ESR 13
My Secondment in Barcelona
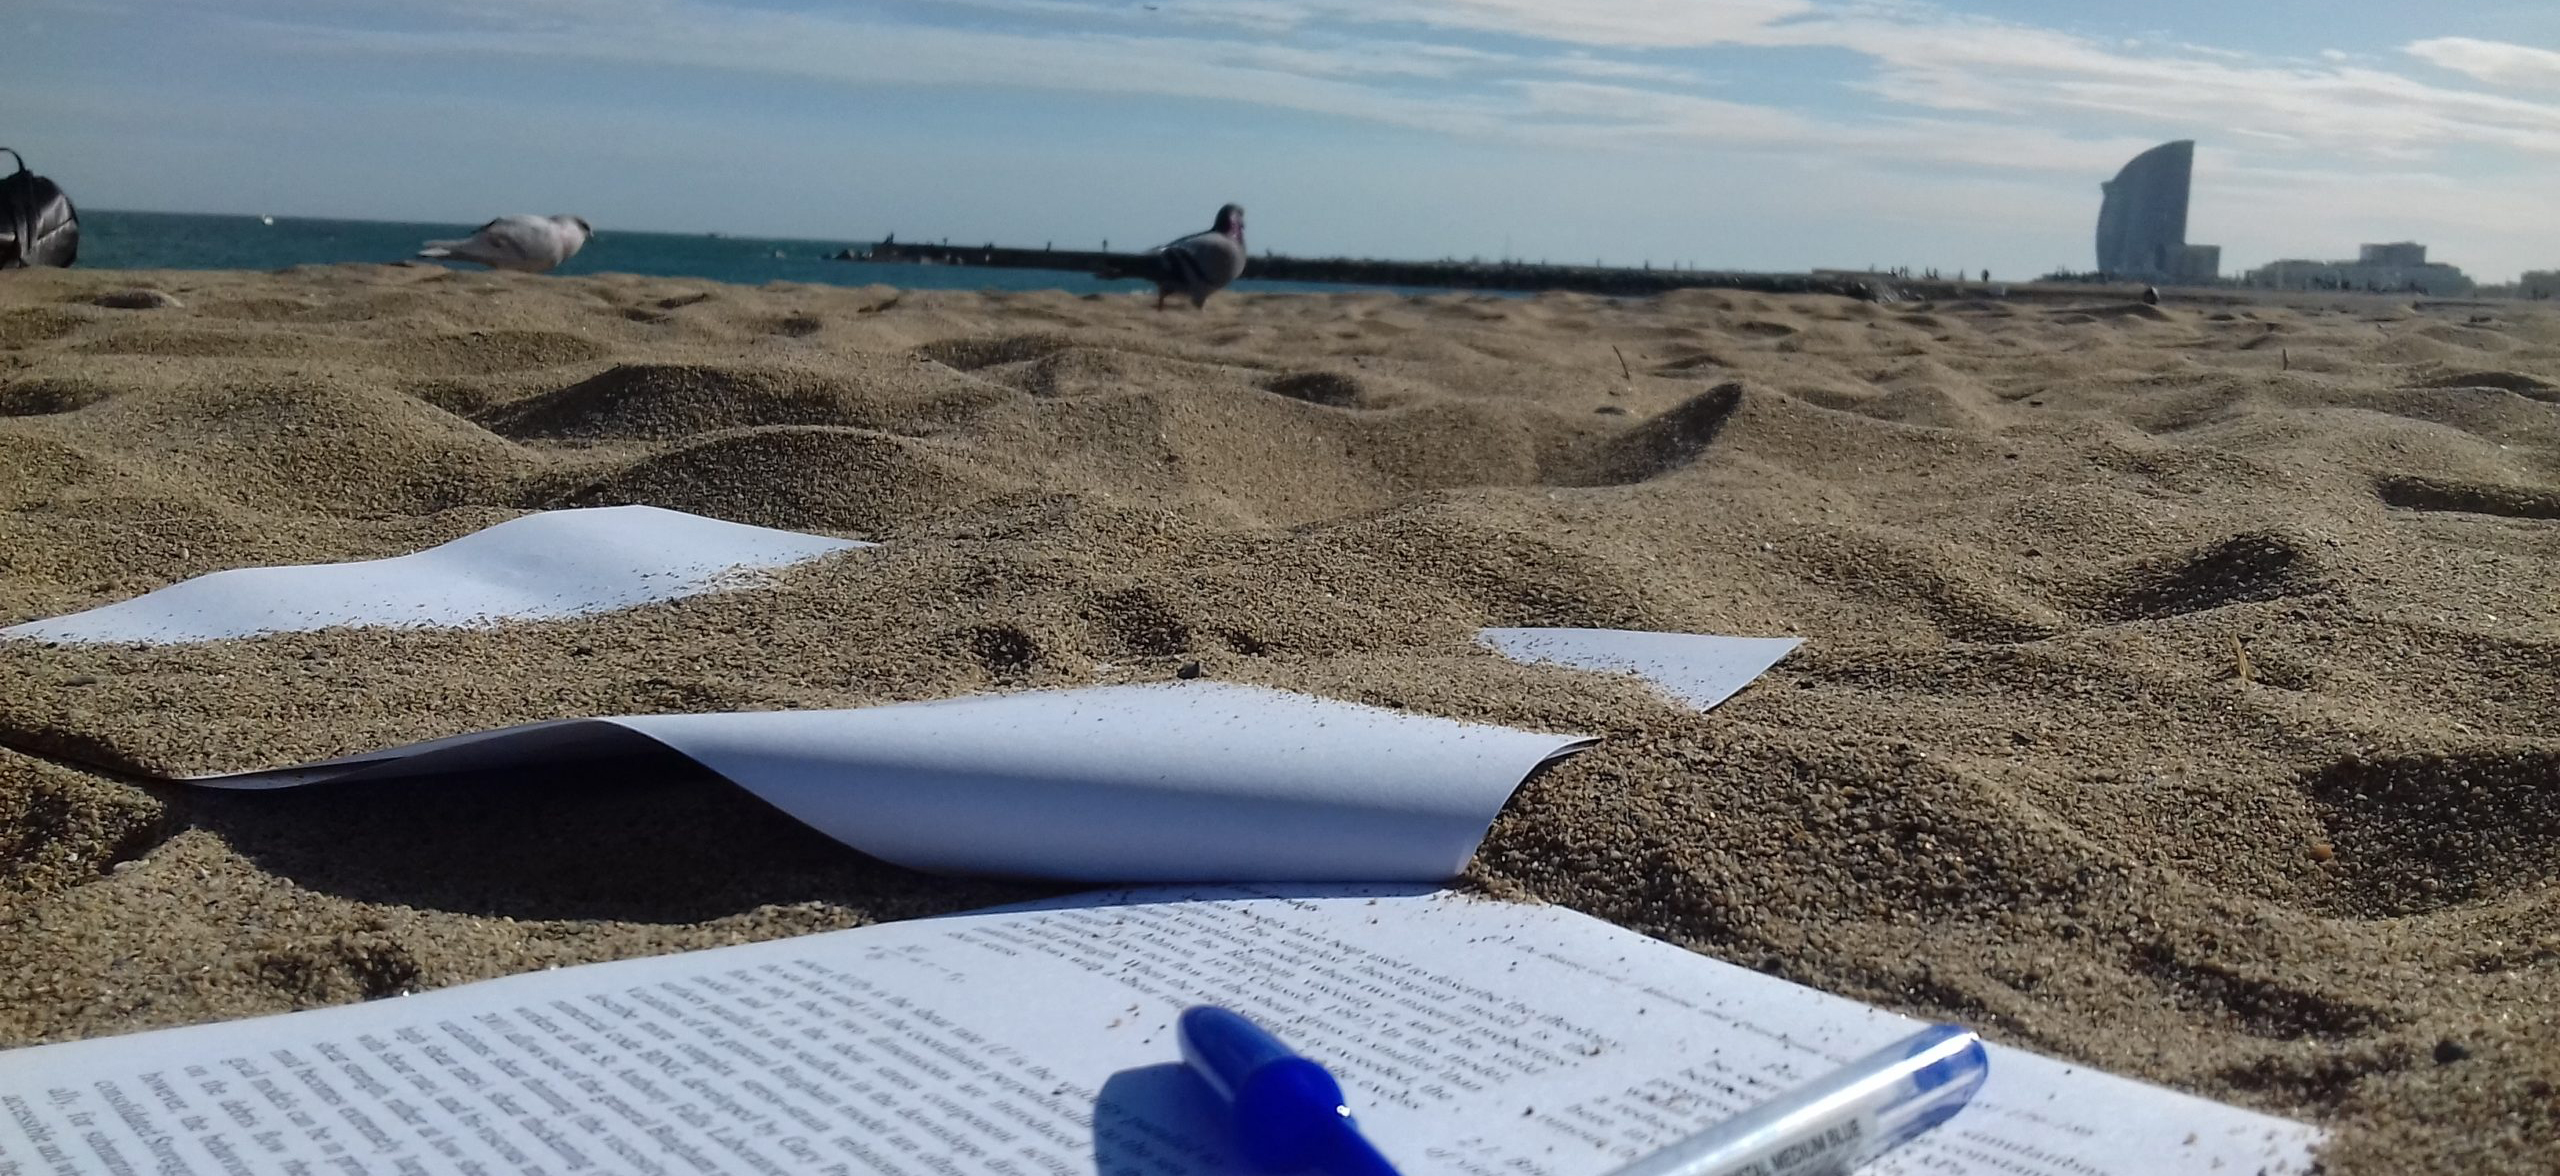
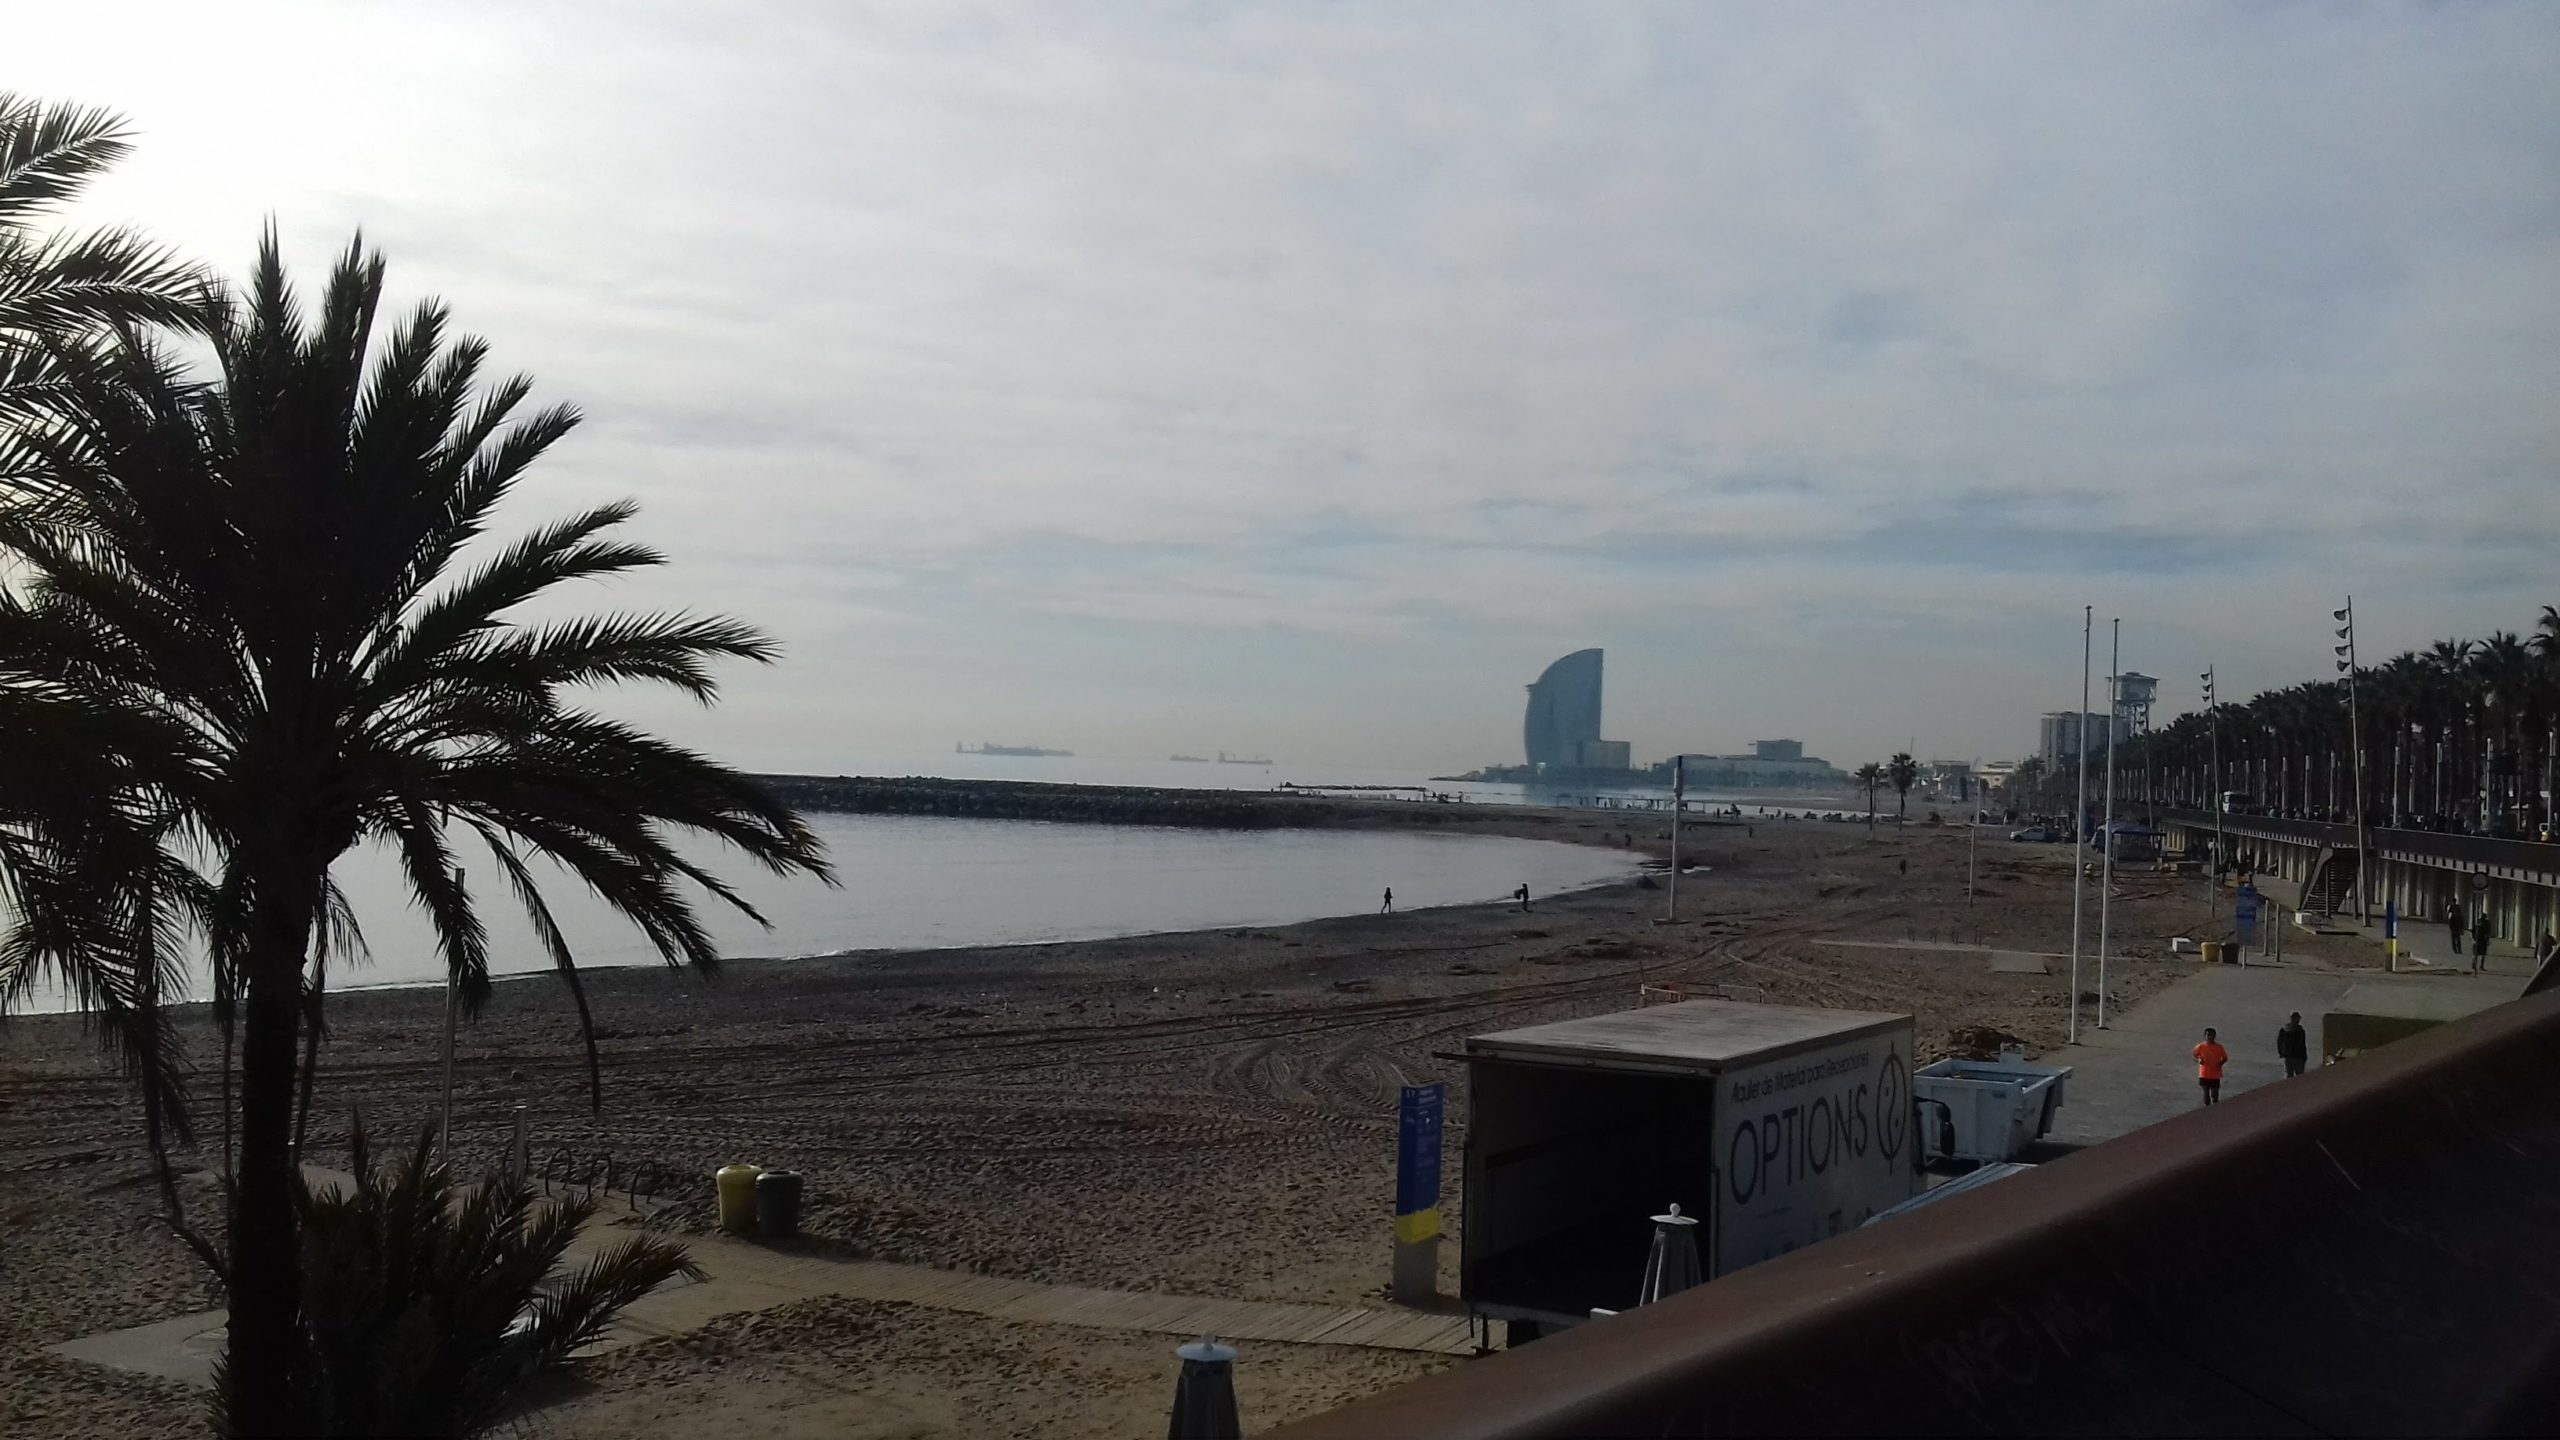
Thomas Zengaffinen (ESR13) | @ ICM-CSIC Barcelona (1 February - 15 March 2020)
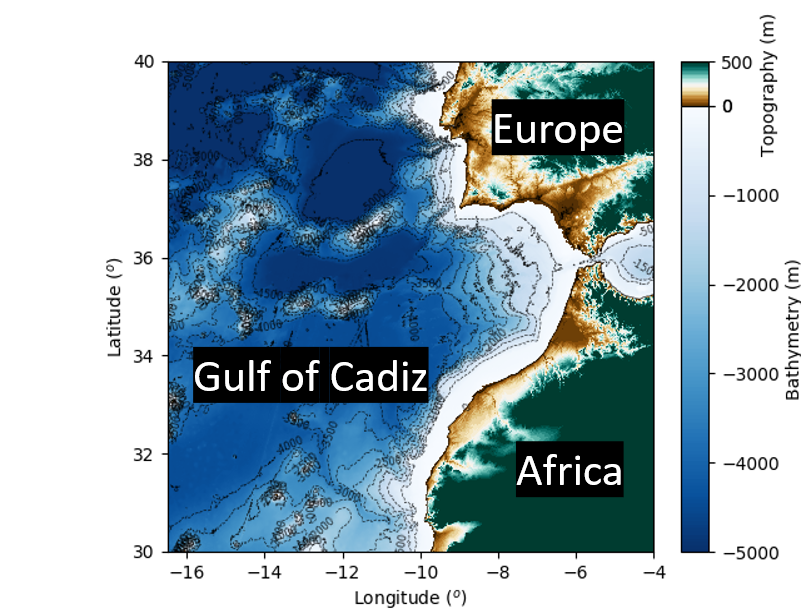
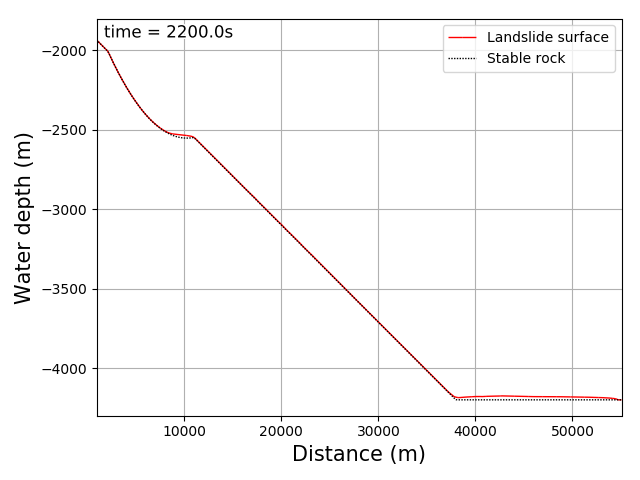
The last chapter of my PhD deals with the baseline for a probabilistic tsunami hazard analysis in the Gulf of Cadiz. A PTHA study reflects all possible events rather than only a worst-case scenario as it was done in the past. The tsunami sources are submarine landslides. In my previous chapters, I investigated the interaction between the landslide's failure mechanics and wave generation in idealised settings and also in real events. This knowledge will help to conduct this last chapter.
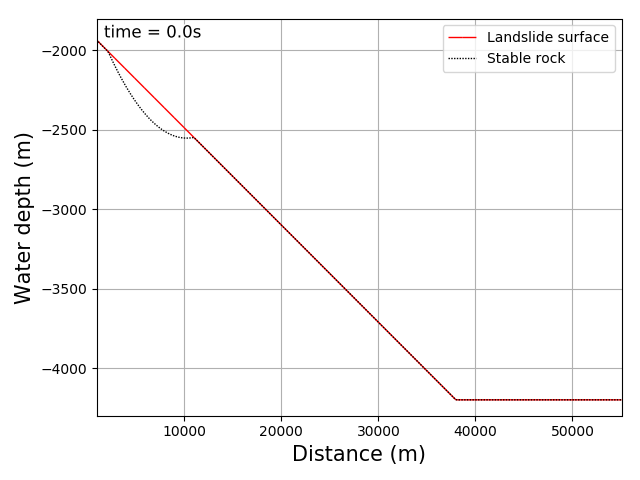
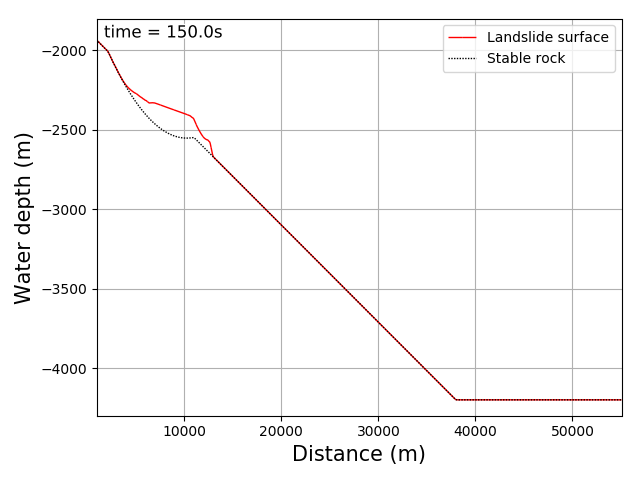
The probabilistic framework involves parameter uncertainties. Geotechnical parameters like yield strength, its softening rate, and drag coefficients can be estimated from previous landslide modelling such as the Storegga Slide or the Grand Banks slump and landslide. However, these sediments had been glaciated, while the sediments in the Gulf of Cadiz were not. Therefore we will calibrate geotechnical parameters using the volume to runout ratio relationship from the landslide catalogue of the Gulf of Cadiz. This landslide catalogue is been developed by ESR14 student, William Meservy.
The volume to runout ratio relationship is far from a perfect fit. A possible reason for this is the involvement of all different landslides with different geometrical representations, be it the initial landslide shape or sea floor shape where the landslide evolved. This makes it a challenge to calibrate our geotechnical model parameters. A way to tackle this problem is to analyse the type of landslide and its initial shape. This information can be retrieved from the landslide catalogue. Altogether, this work is an important basis for a PTHA in the Gulf of Cadiz.
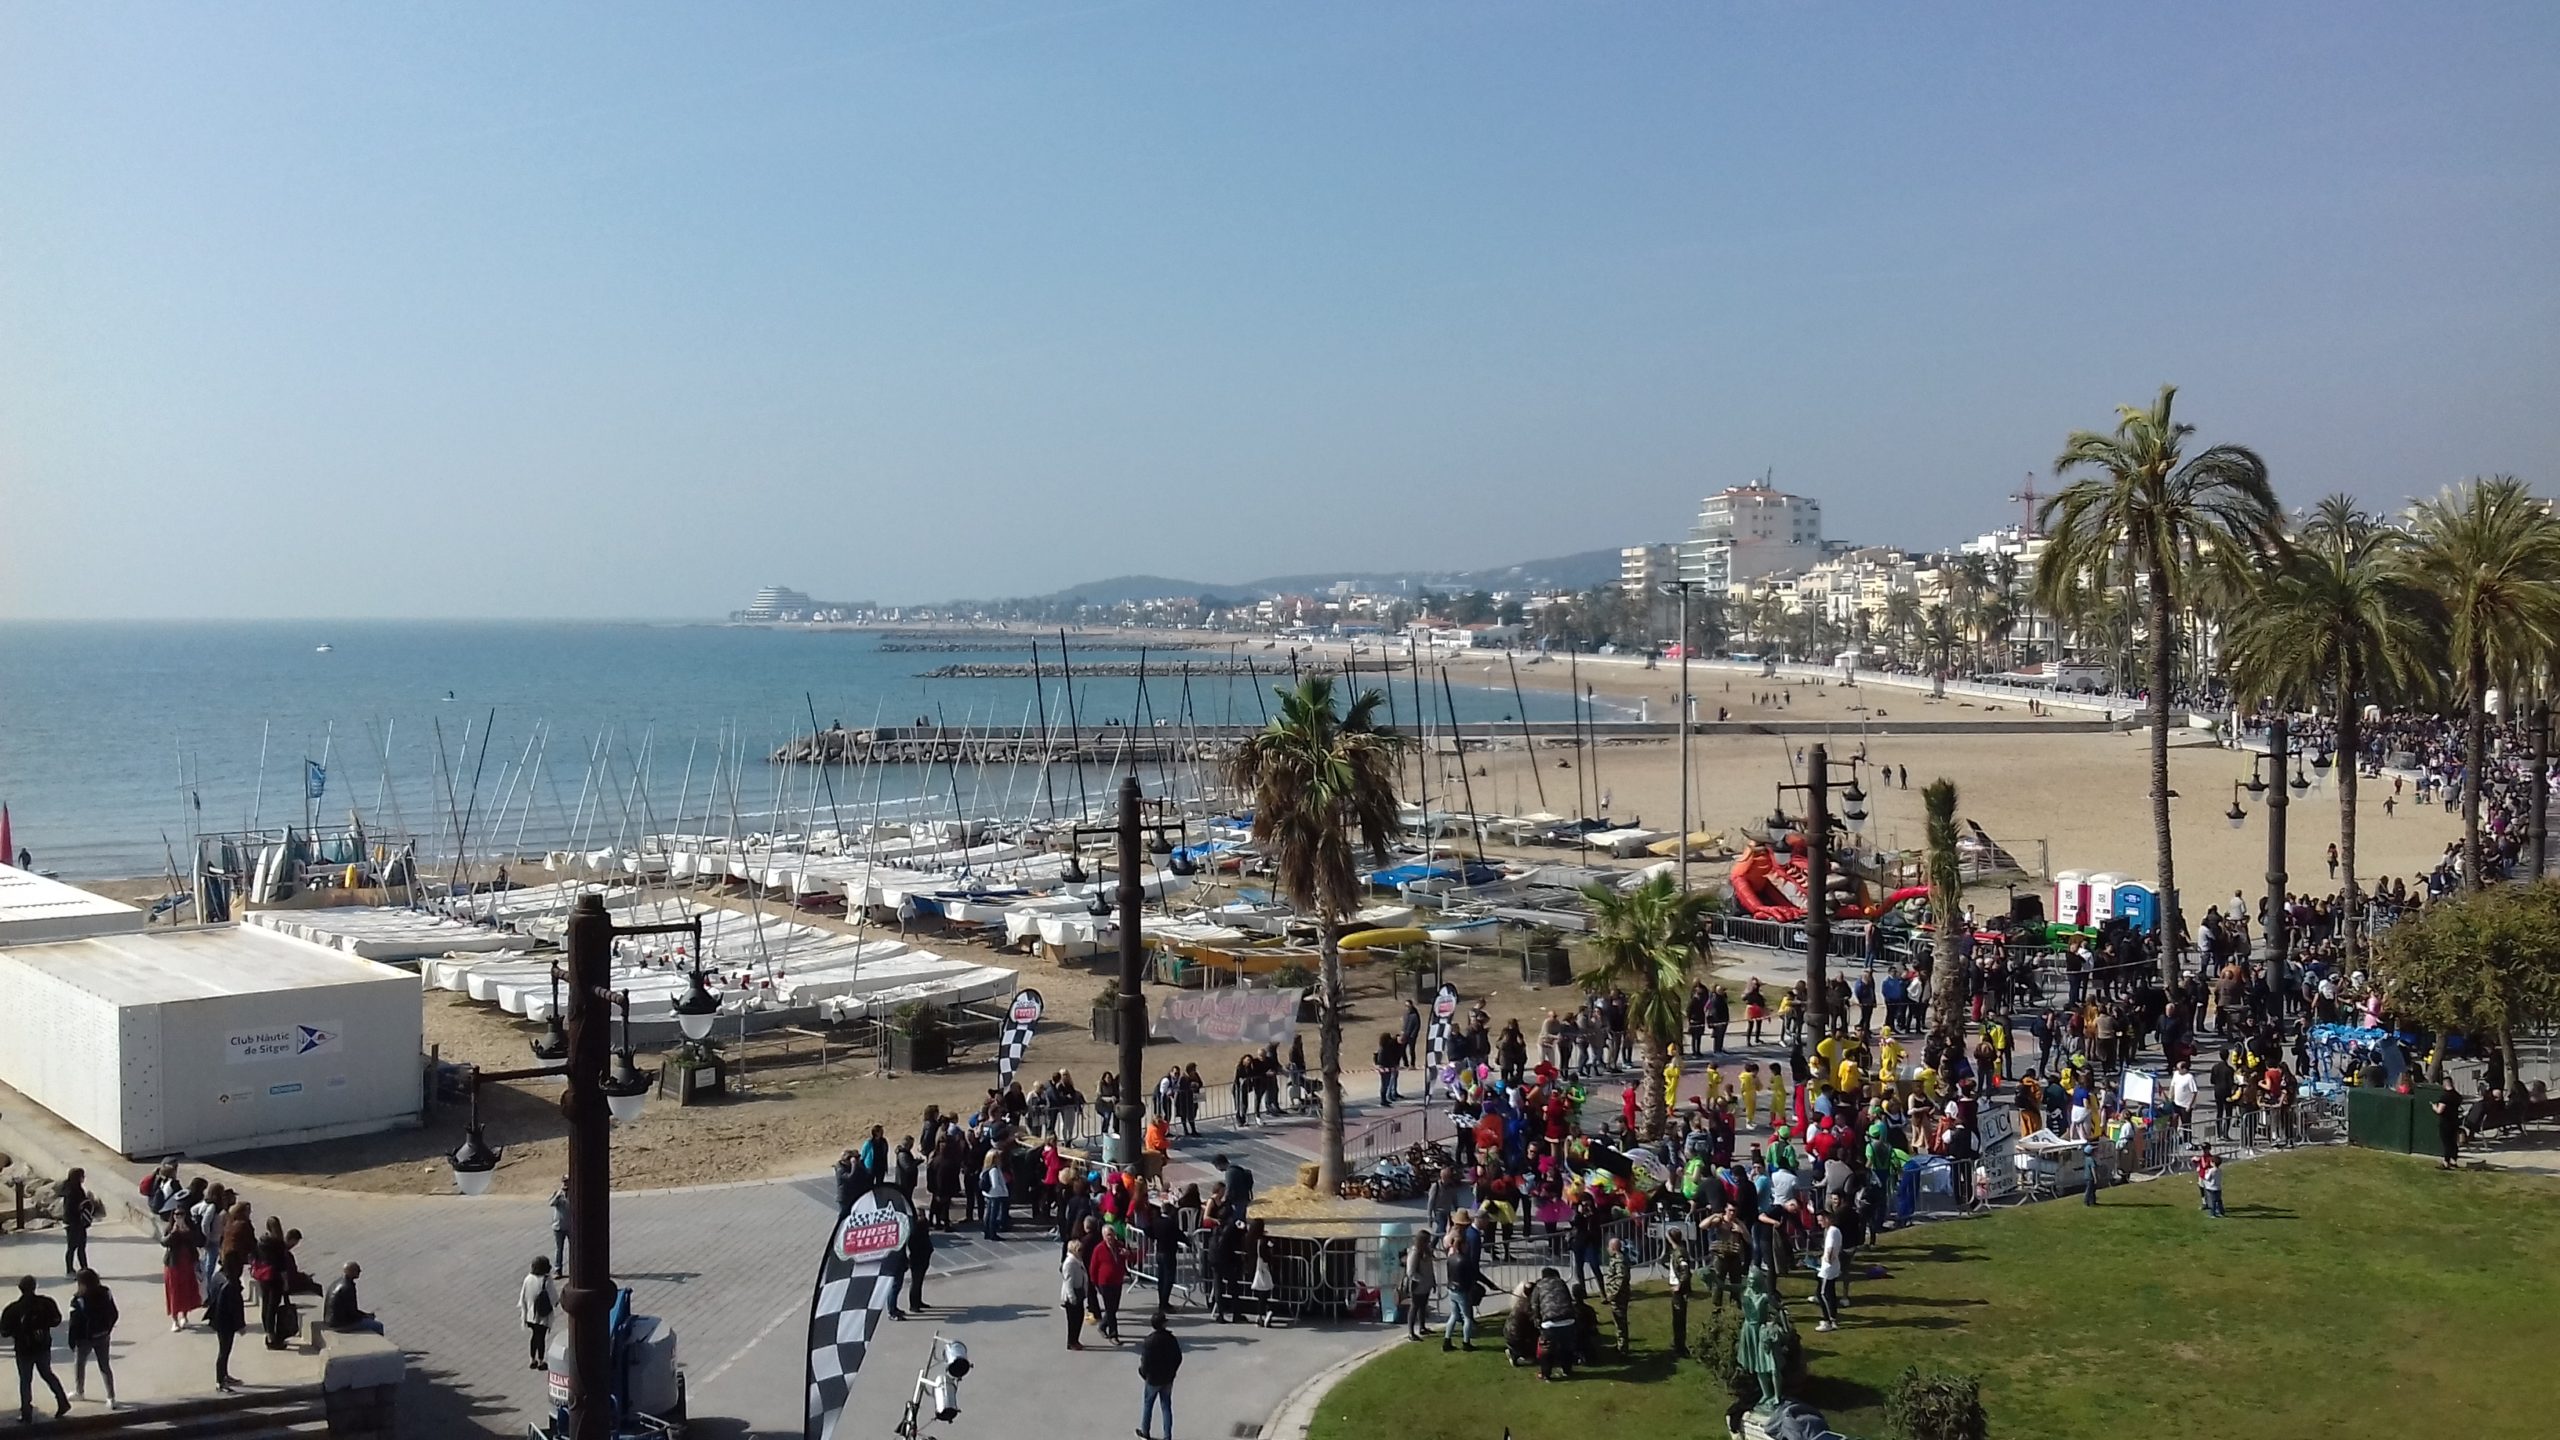
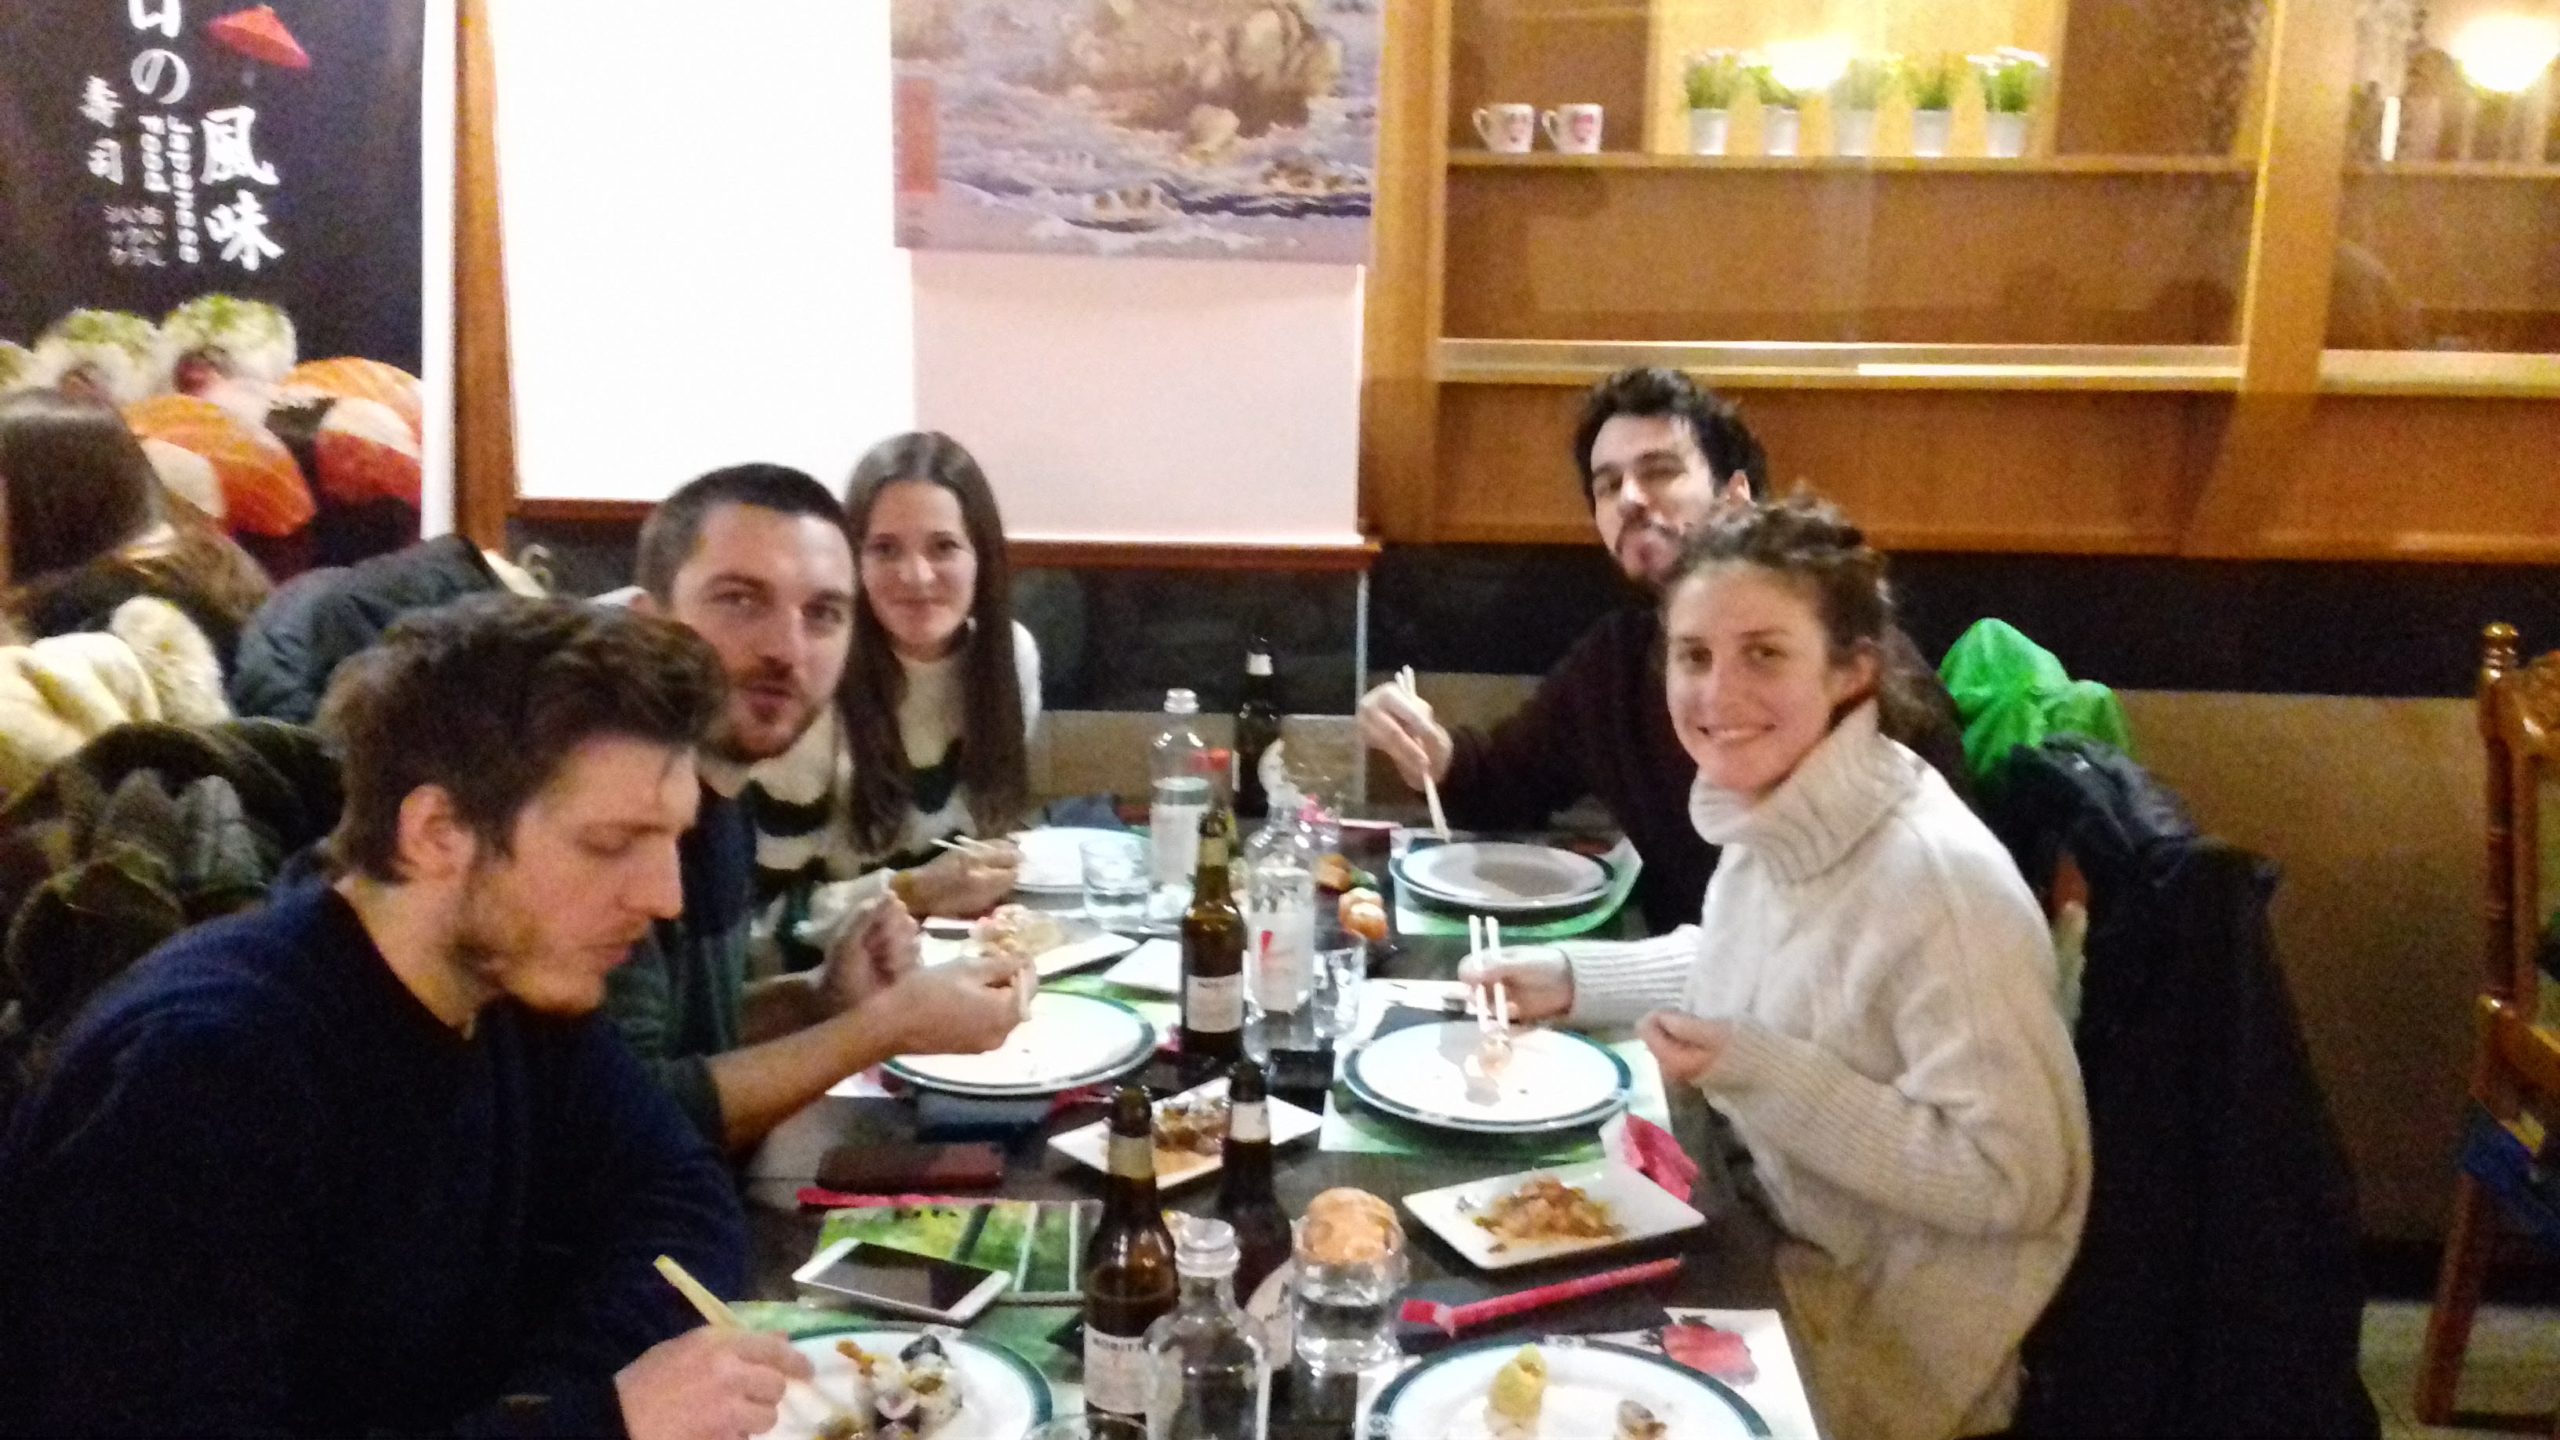
Apart from science, I was curious to learn about Catalan culture. ESR students, Davide Mencaroni, Johnny Ford, William Meservy, Stefano Collico, other friendly colleagues from the Institute of Marine Sciences ICM, and my two flatmates, Ana Leblanc and Ramon Bascompte, introduced me into the Catalan culture. Thank you for these great times. Unfortunately, around midtime of my secondment, we got limited to exploit the Catalan culture and even working at the institute due to the tragic worldwide Covid-19 outbreak. Thus, with the agreement with my supervisors and the project leader, I paused my secondment and flew back home straight into a two-week quarantine.
Location
- ICM - CSIC Barcelona, ESP
Impressions
@ CNR-ISMAR Bologna, Italy (15 - 21 September 2019) | 2019-10-30
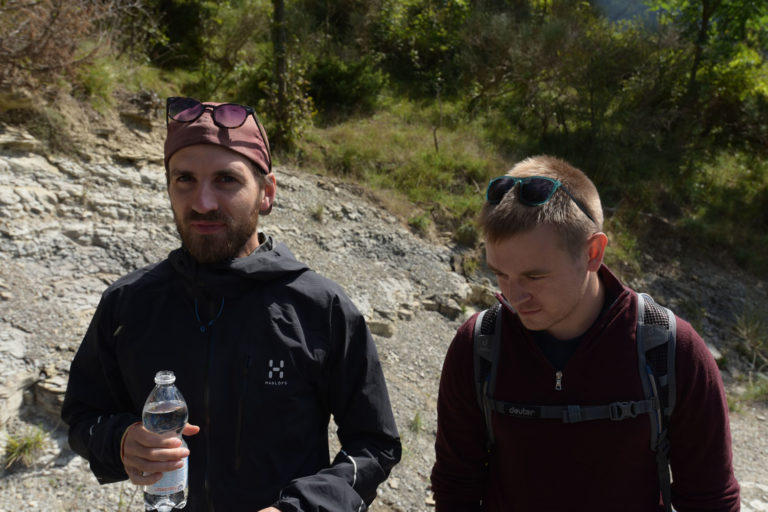
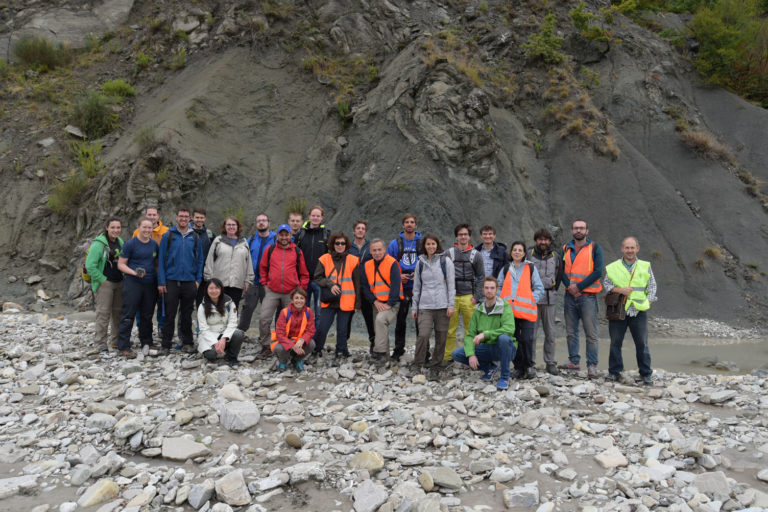
Bologna SLATE Workshop - A discovery of turbidites or maybe more?
Ricarda Gatter (ESR 9) , Thomas Zengaffinen, (ESR 13) | @ CNR-ISMAR Bologna, Italy 15-21 September 2019It is done! After long months in the office, lab, field and on the ship; reading papers, gathering data, measuring, analysing, questioning and discussing, you are DONE. The only thing that is left is writing it all up. Easy, right? Well, if you are like us you will find that it is actually quite challenging.
“To present a scientific subject in an attractive and stimulating manner is an artistic task, similar to that of a novelist or even a dramatic writer.”
(Max Born)
During our third SLATE workshop in Bologna, Mike Clare (NOC, Southampton) took it upon him to “teach” us how to write a good scientific paper, or at least try. We started with analysing papers that we like and discuss why we picked these specific papers. From there we began to talk about the structure of papers and to work on our own.
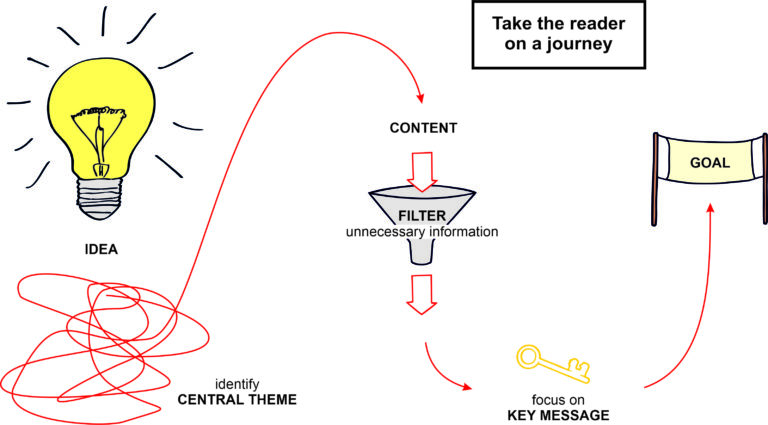
 What we learned:
- Structure is key
- Start with bullet points and expand out
- Focus on the main question, do not include unnecessary information
- Check the logic flows
- Keep it simple
“Have something to say, and say it as clearly as you can. That is the only secret of style.”
(Matthew Arnold)
“Keep everything as simple as possible, but not simpler.”
(Albert Einstein)
 And most importantly, PRACTICE, PRACTICE, PRACTICE …
“A professional writer is an amateur who didn’t quit.”
Richard Bach
Thanks to Mike Clare for an insightful course, helpful discussions and some great quotes and pictures.
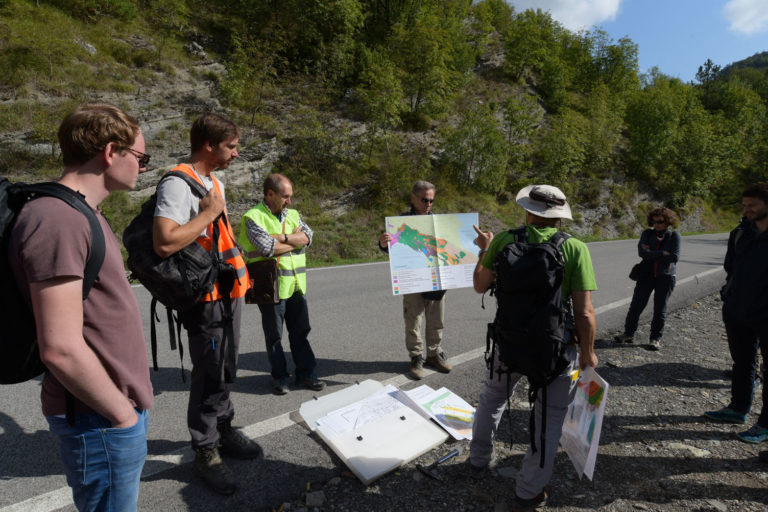
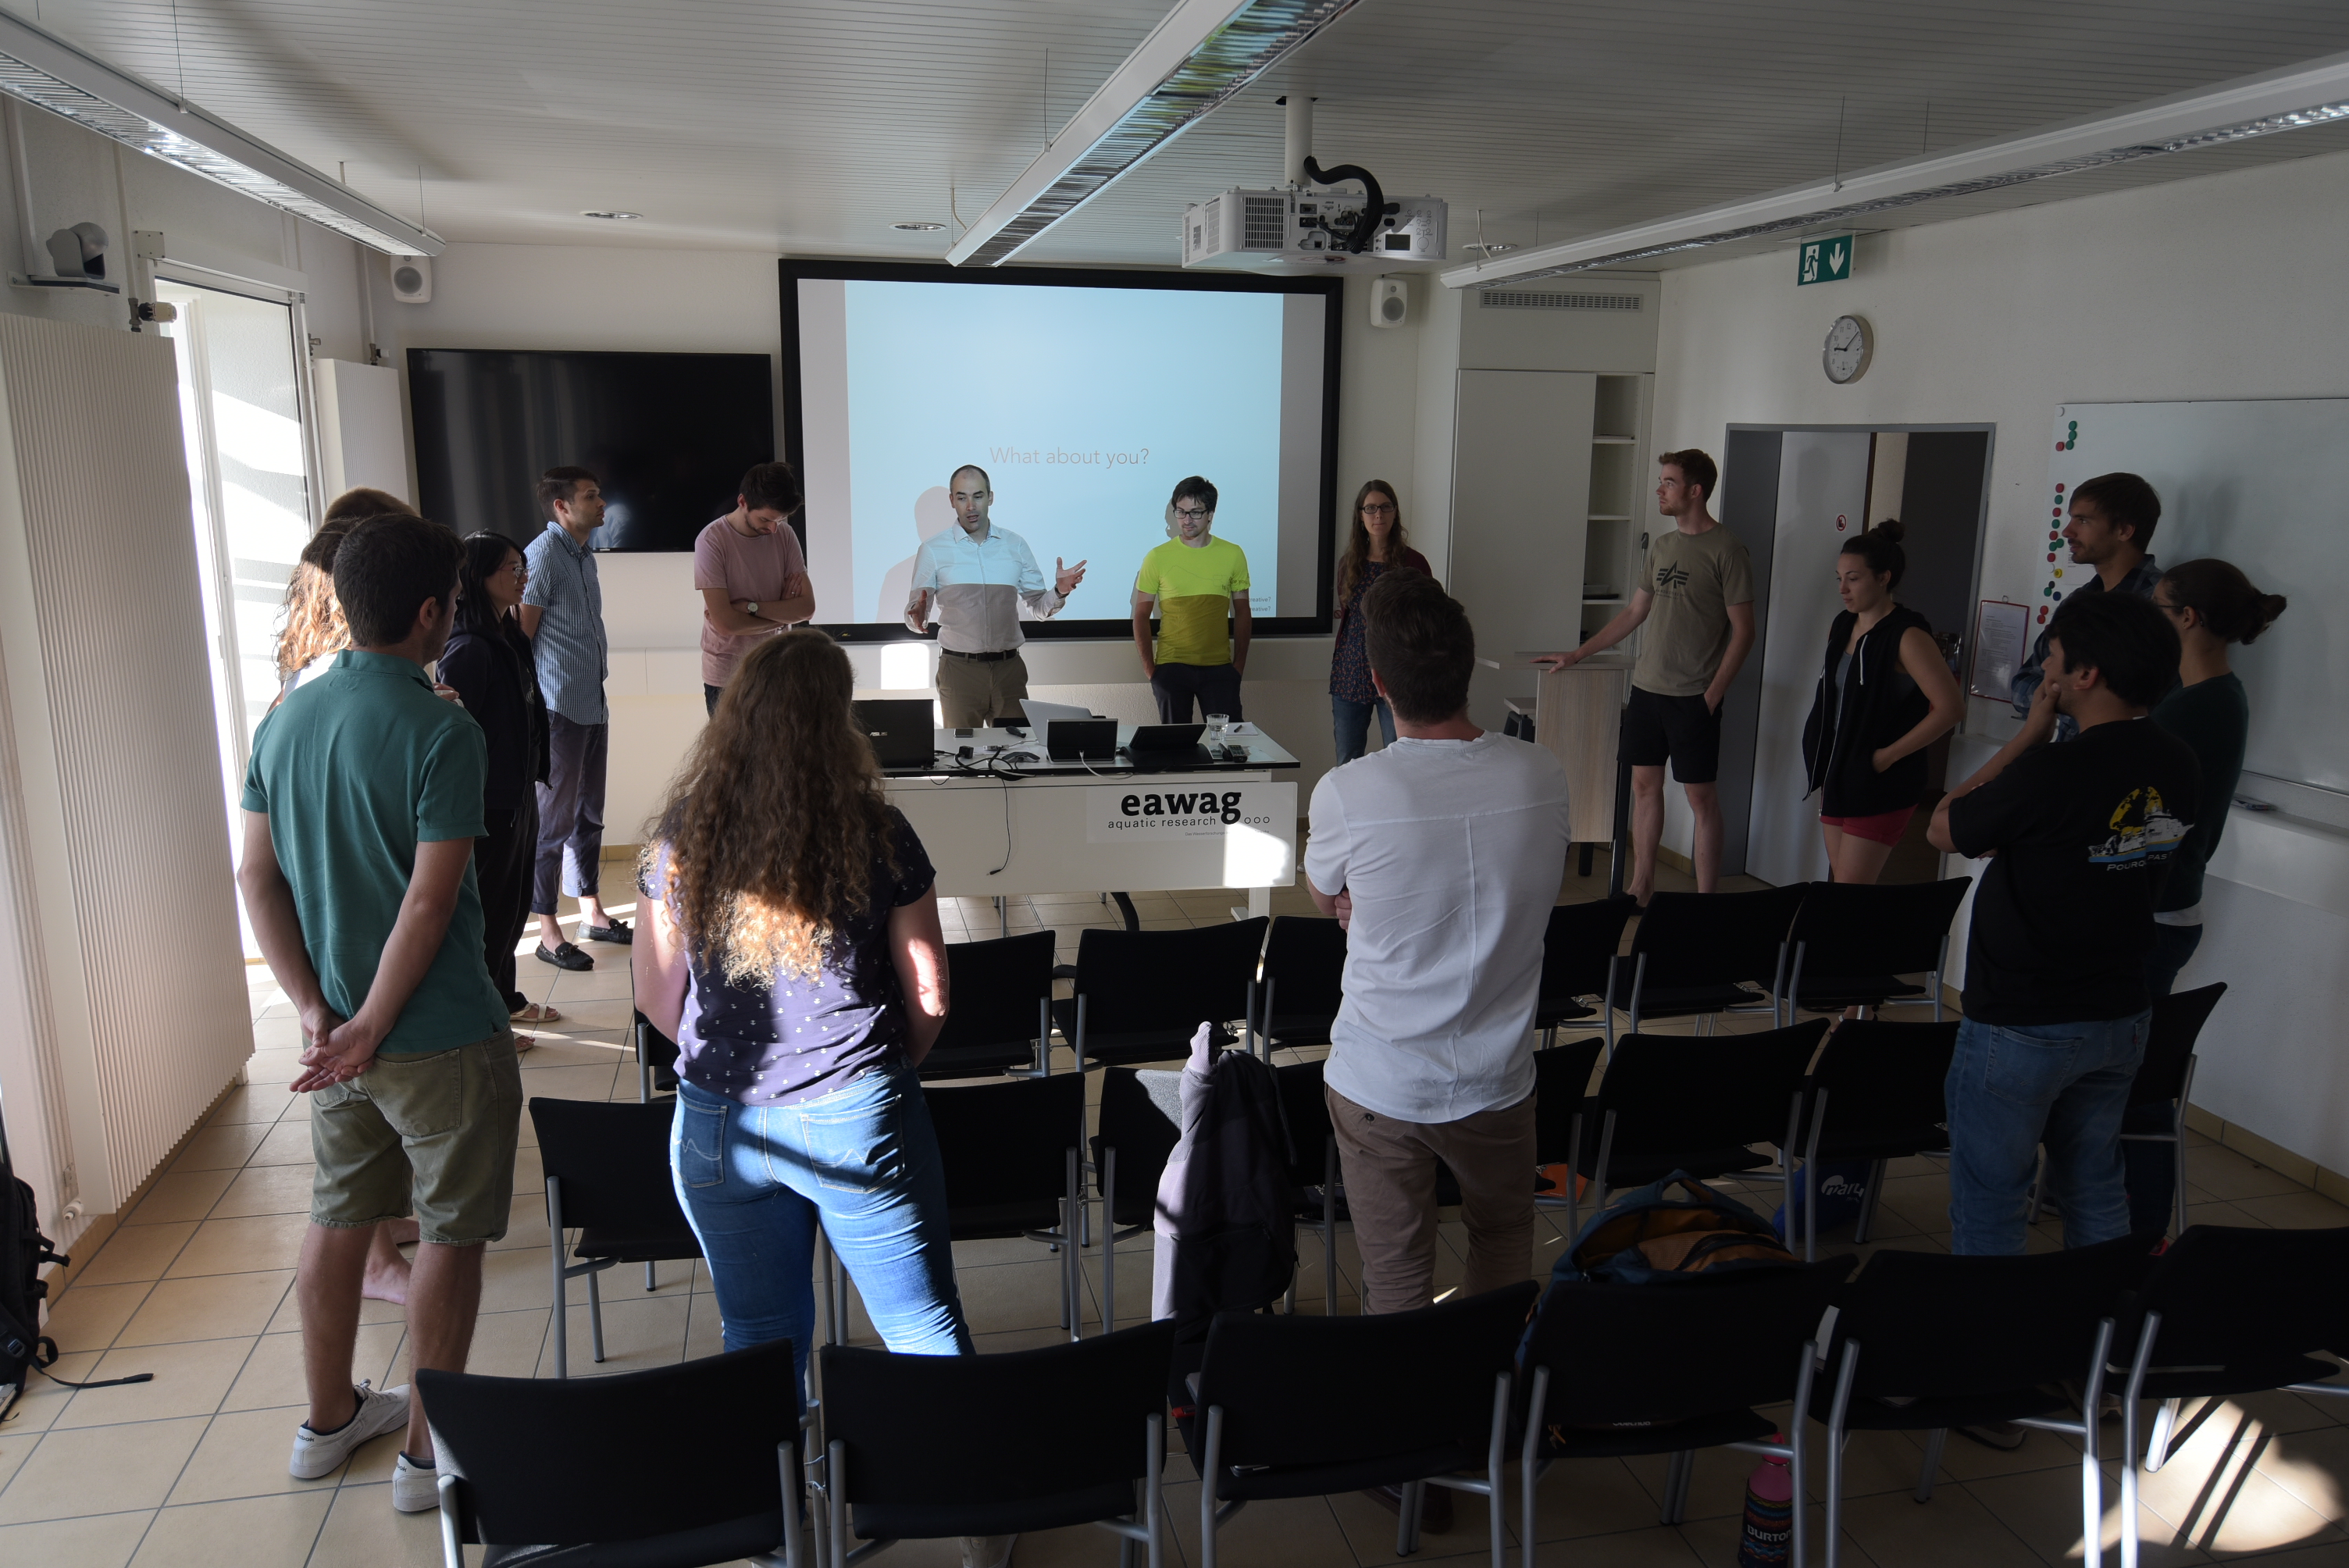
Science dramaturgy: creating an exciting story taking inspiration from scienceNot only is it important to convey your key message as simple as possible in a written text, it is also necessary to be able to do so in oral presentations. Why not integrate your key message into a story? One day of your annual workshop was designated to ‘scientific storytelling’ with Dr. Andrea Brunello, who held a seminar on ‘Science dramaturgy: creating an exciting story taking inspiration from science’. Start your story with some background information (balance), then present an unforeseeable problem (unbalance), and throughout the presentation, find a solution for the problem (rebalance with a significant change). Do not just list facts while you are presenting. If there is no tension, your key message is not relevant for the audience.
Grab the audience’s attention from the very beginning. If you do not excite the audience within the first ten seconds of your presentation, you have lost them forever. Therefore, start with something catchy, relatable, what we call a ‘hook’.
Relate your research to yourself, tell the story as if you experienced it yourself in order to convey emotions to the audience and to keep their attention. Nevertheless, do not get emotional yourself but raise the emotional state of the audience. Your talk will be a ‘great talk’ if you present something the audience can easily remember. The story around your scientific results helps the audience to remember your facts in an easier way. However, what the audience should remember are your newly found scientific findings. During your talk, never forget your important scientific key message!
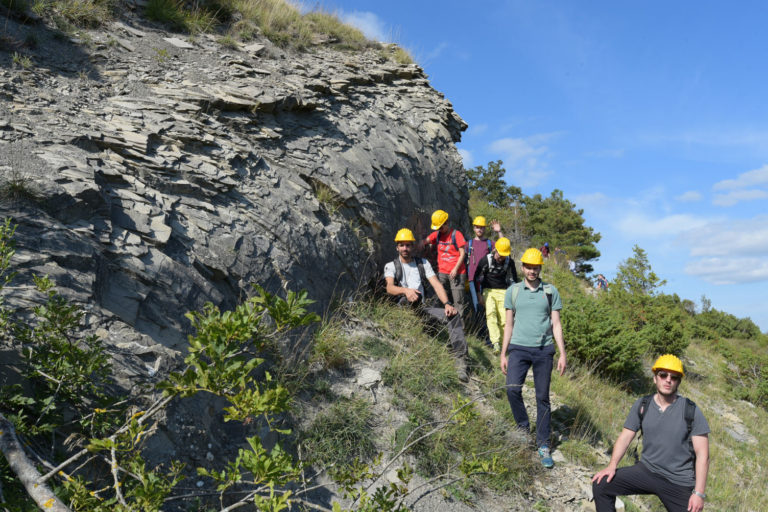
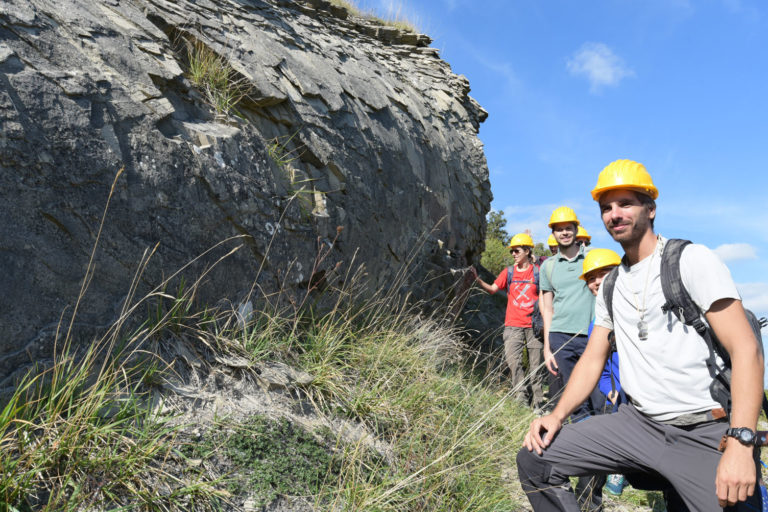
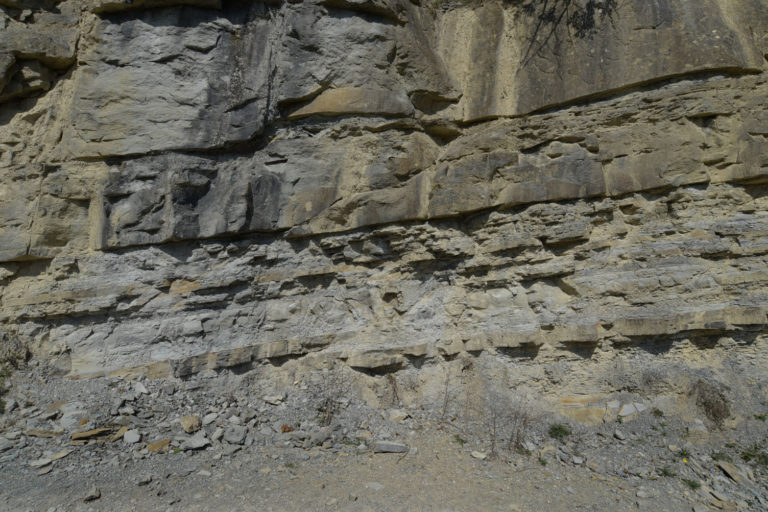
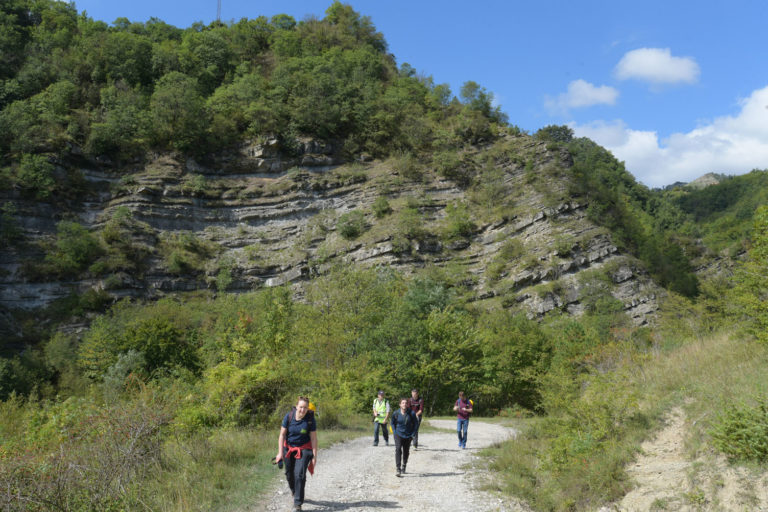
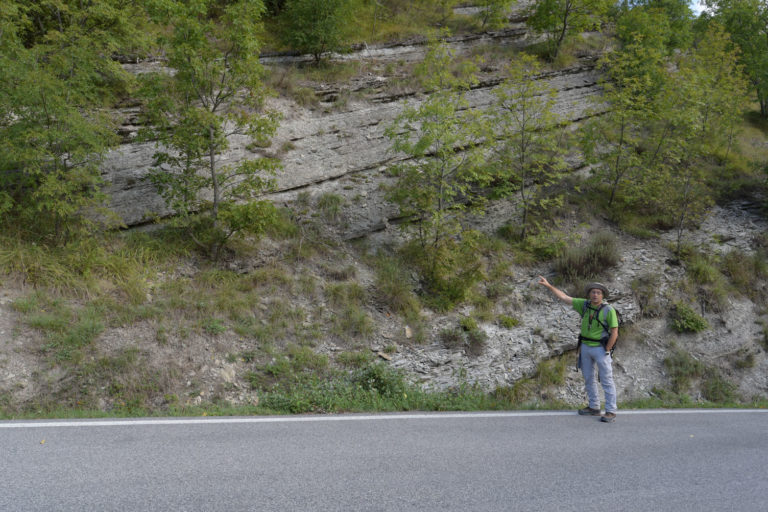
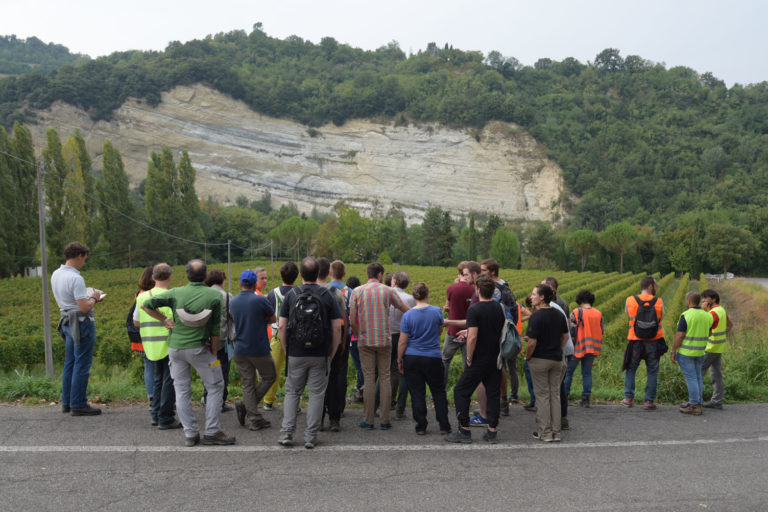
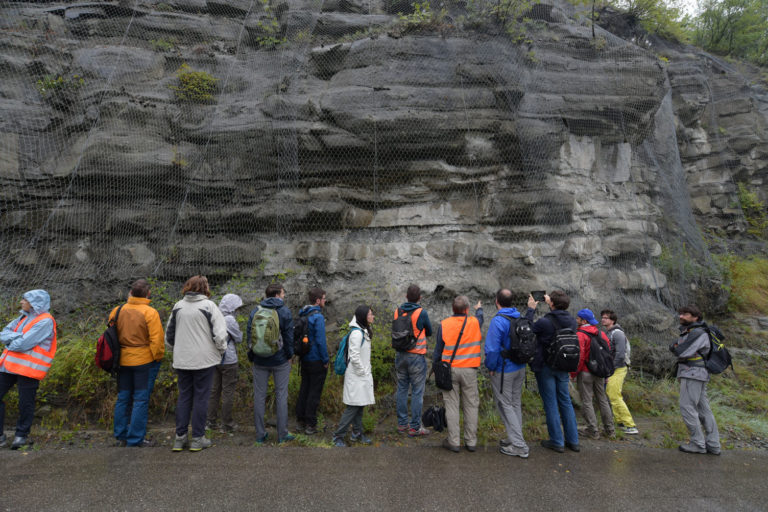
Field tripSubaqueous sediment-laden density flows, called turbidity currents, can travel for hundreds of kilometres and damage important seafloor infrastructure, such as telecommunication cables that support 95% of the international communication, and expensive oil and gas platforms and pipelines. We measure turbidity currents directly, analyse their deposits (turbidites) in sediment cores, and try to reconstruct their dynamics and deposits with numerical simulations. Turbidites have been studied in detail for example because of their hydrocarbon reservoir potential – the sandstone can act as reservoir and the overlying mudstone as seal. However, what do turbidites actually look like?
The ideal vertical succession of turbidites is described by the Bouma sequence, which is divided into five distinct layers A-E (from bottom to top) that are fining upwards. Layers A-C build the lower part of the sequence and consist of coarse- (A) to fine- (C) grained sand(stone). Layer A is massive or normally graded, while layers B and C are laminated. Layer D consists of parallel-laminated silt(stone) and layer E builds the top with massive, ungraded mud(stone).
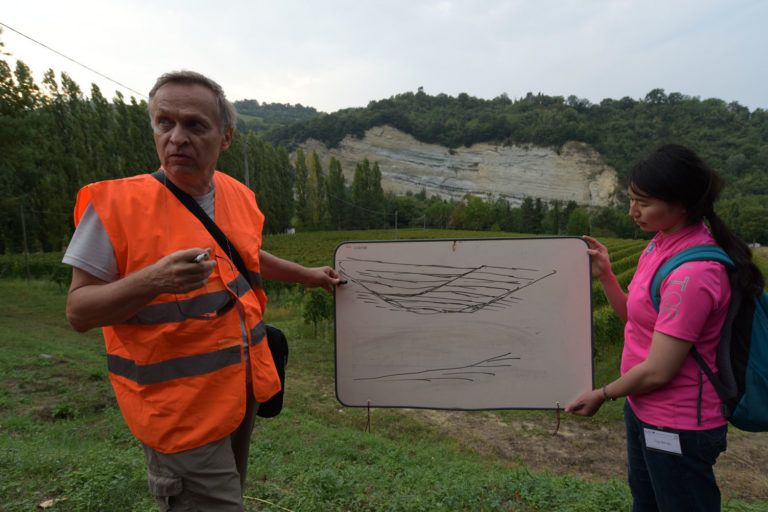
Application in Numerical Modelling
Layer(s) of turbidites on the seafloor have the potential to be re-activated and to move further downslope. Depending on their velocity, grain size, rheology, and thinning of the layer thickness, the sediments will move as either a debris flow, solid blocks, or a slump. In the latter case, the rheology determines the deformation of the moving sediment layers. The sediment layer can build folds that turn with the direction of movement, the same way as mantle rocks in a ductile deformation. Therefore, we can apply the same rheology for the simulation of soft sediments as for mantle rocks in a ductile regime.
One rheology we can apply to these soft, ductile sediments is the viscoplastic rheology. The sediments move after applying critical shear stress, and are permanently deformed. Depth-averaged numerical flow models allow the simulation of these processes. Although we cannot detect any ductile structures (e.g. folds), we can model the slump as an entire mass quite realistically. Location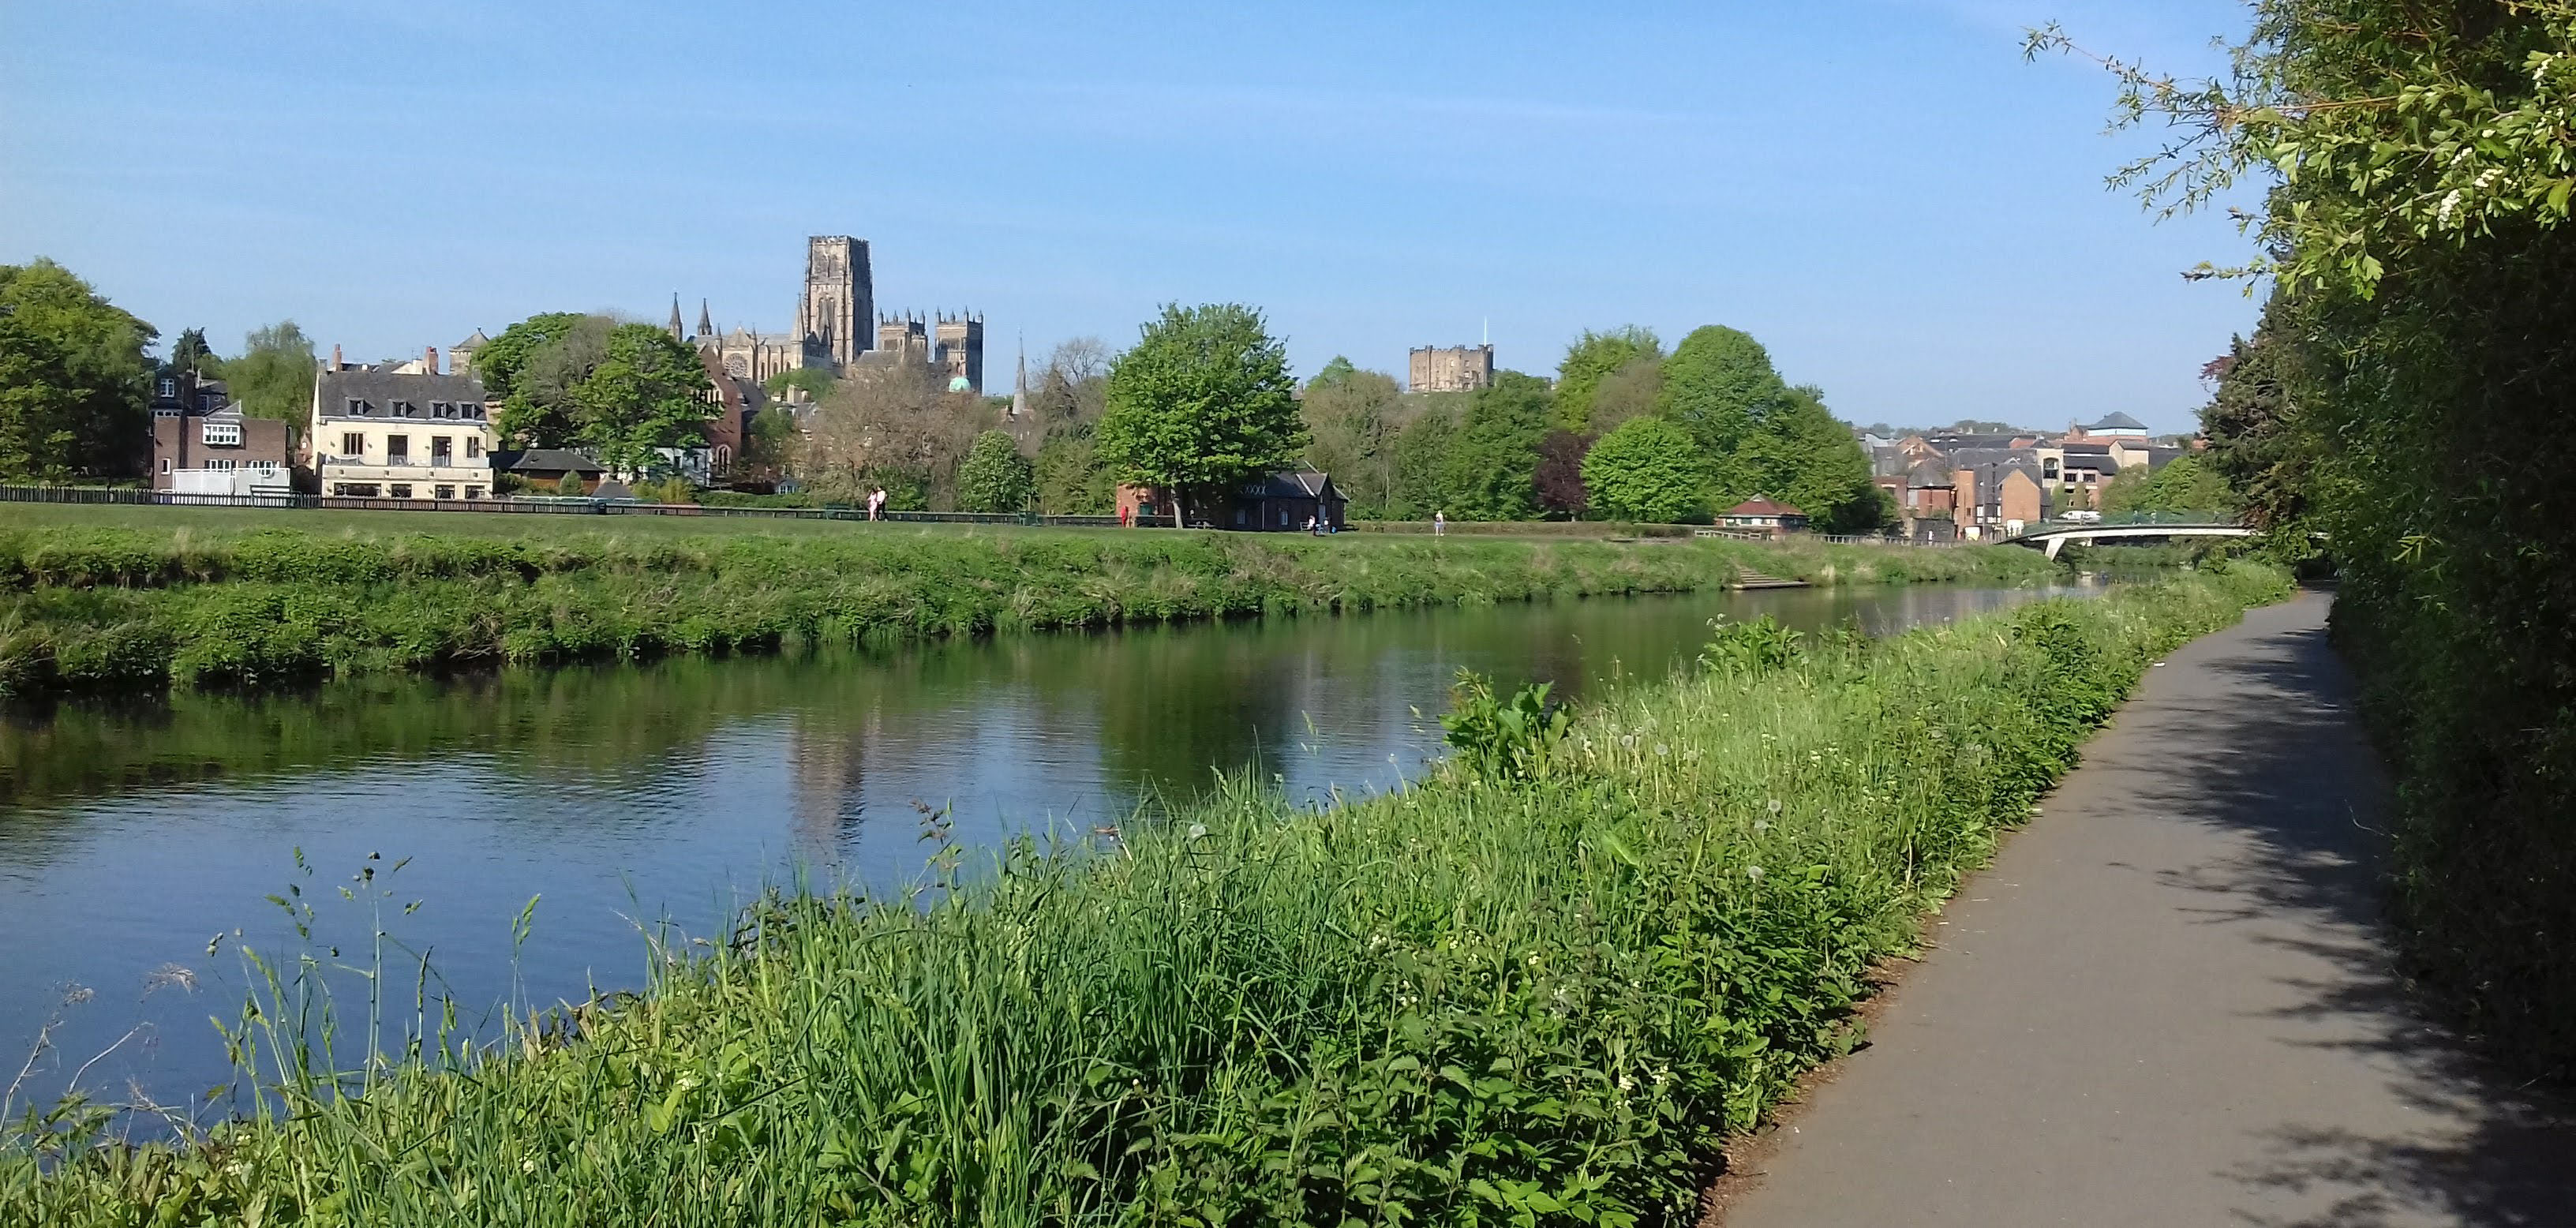
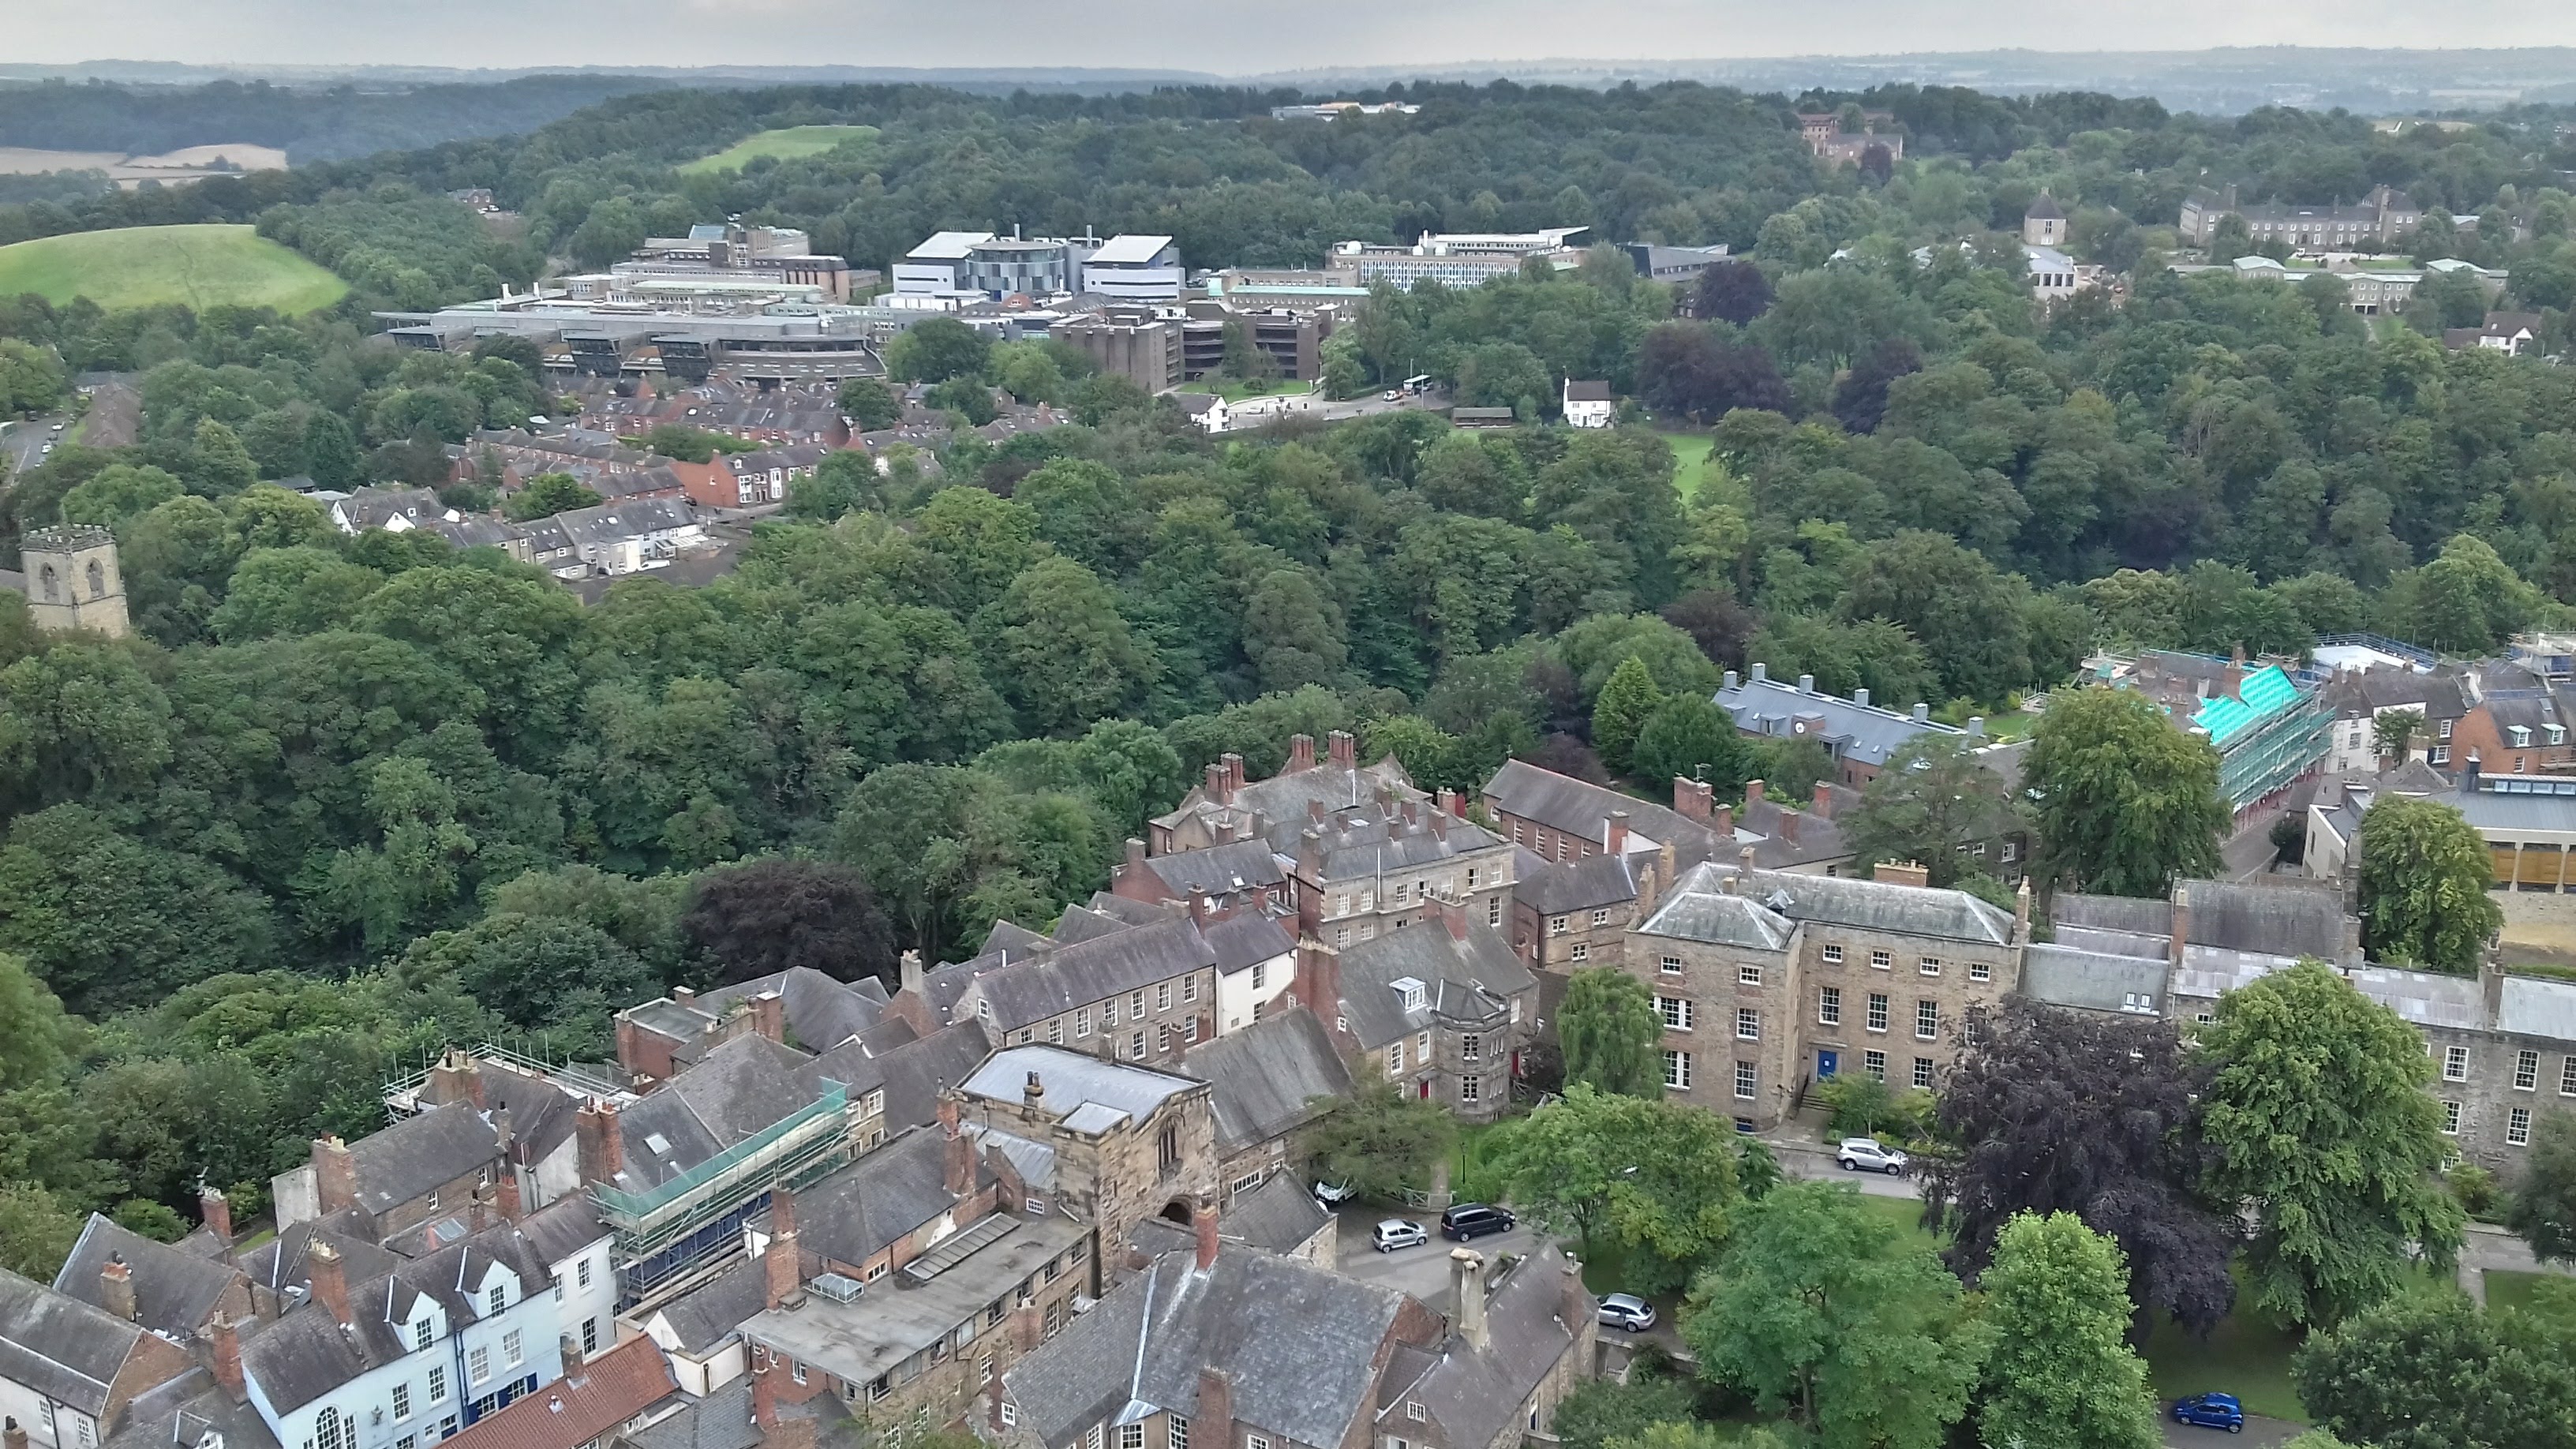
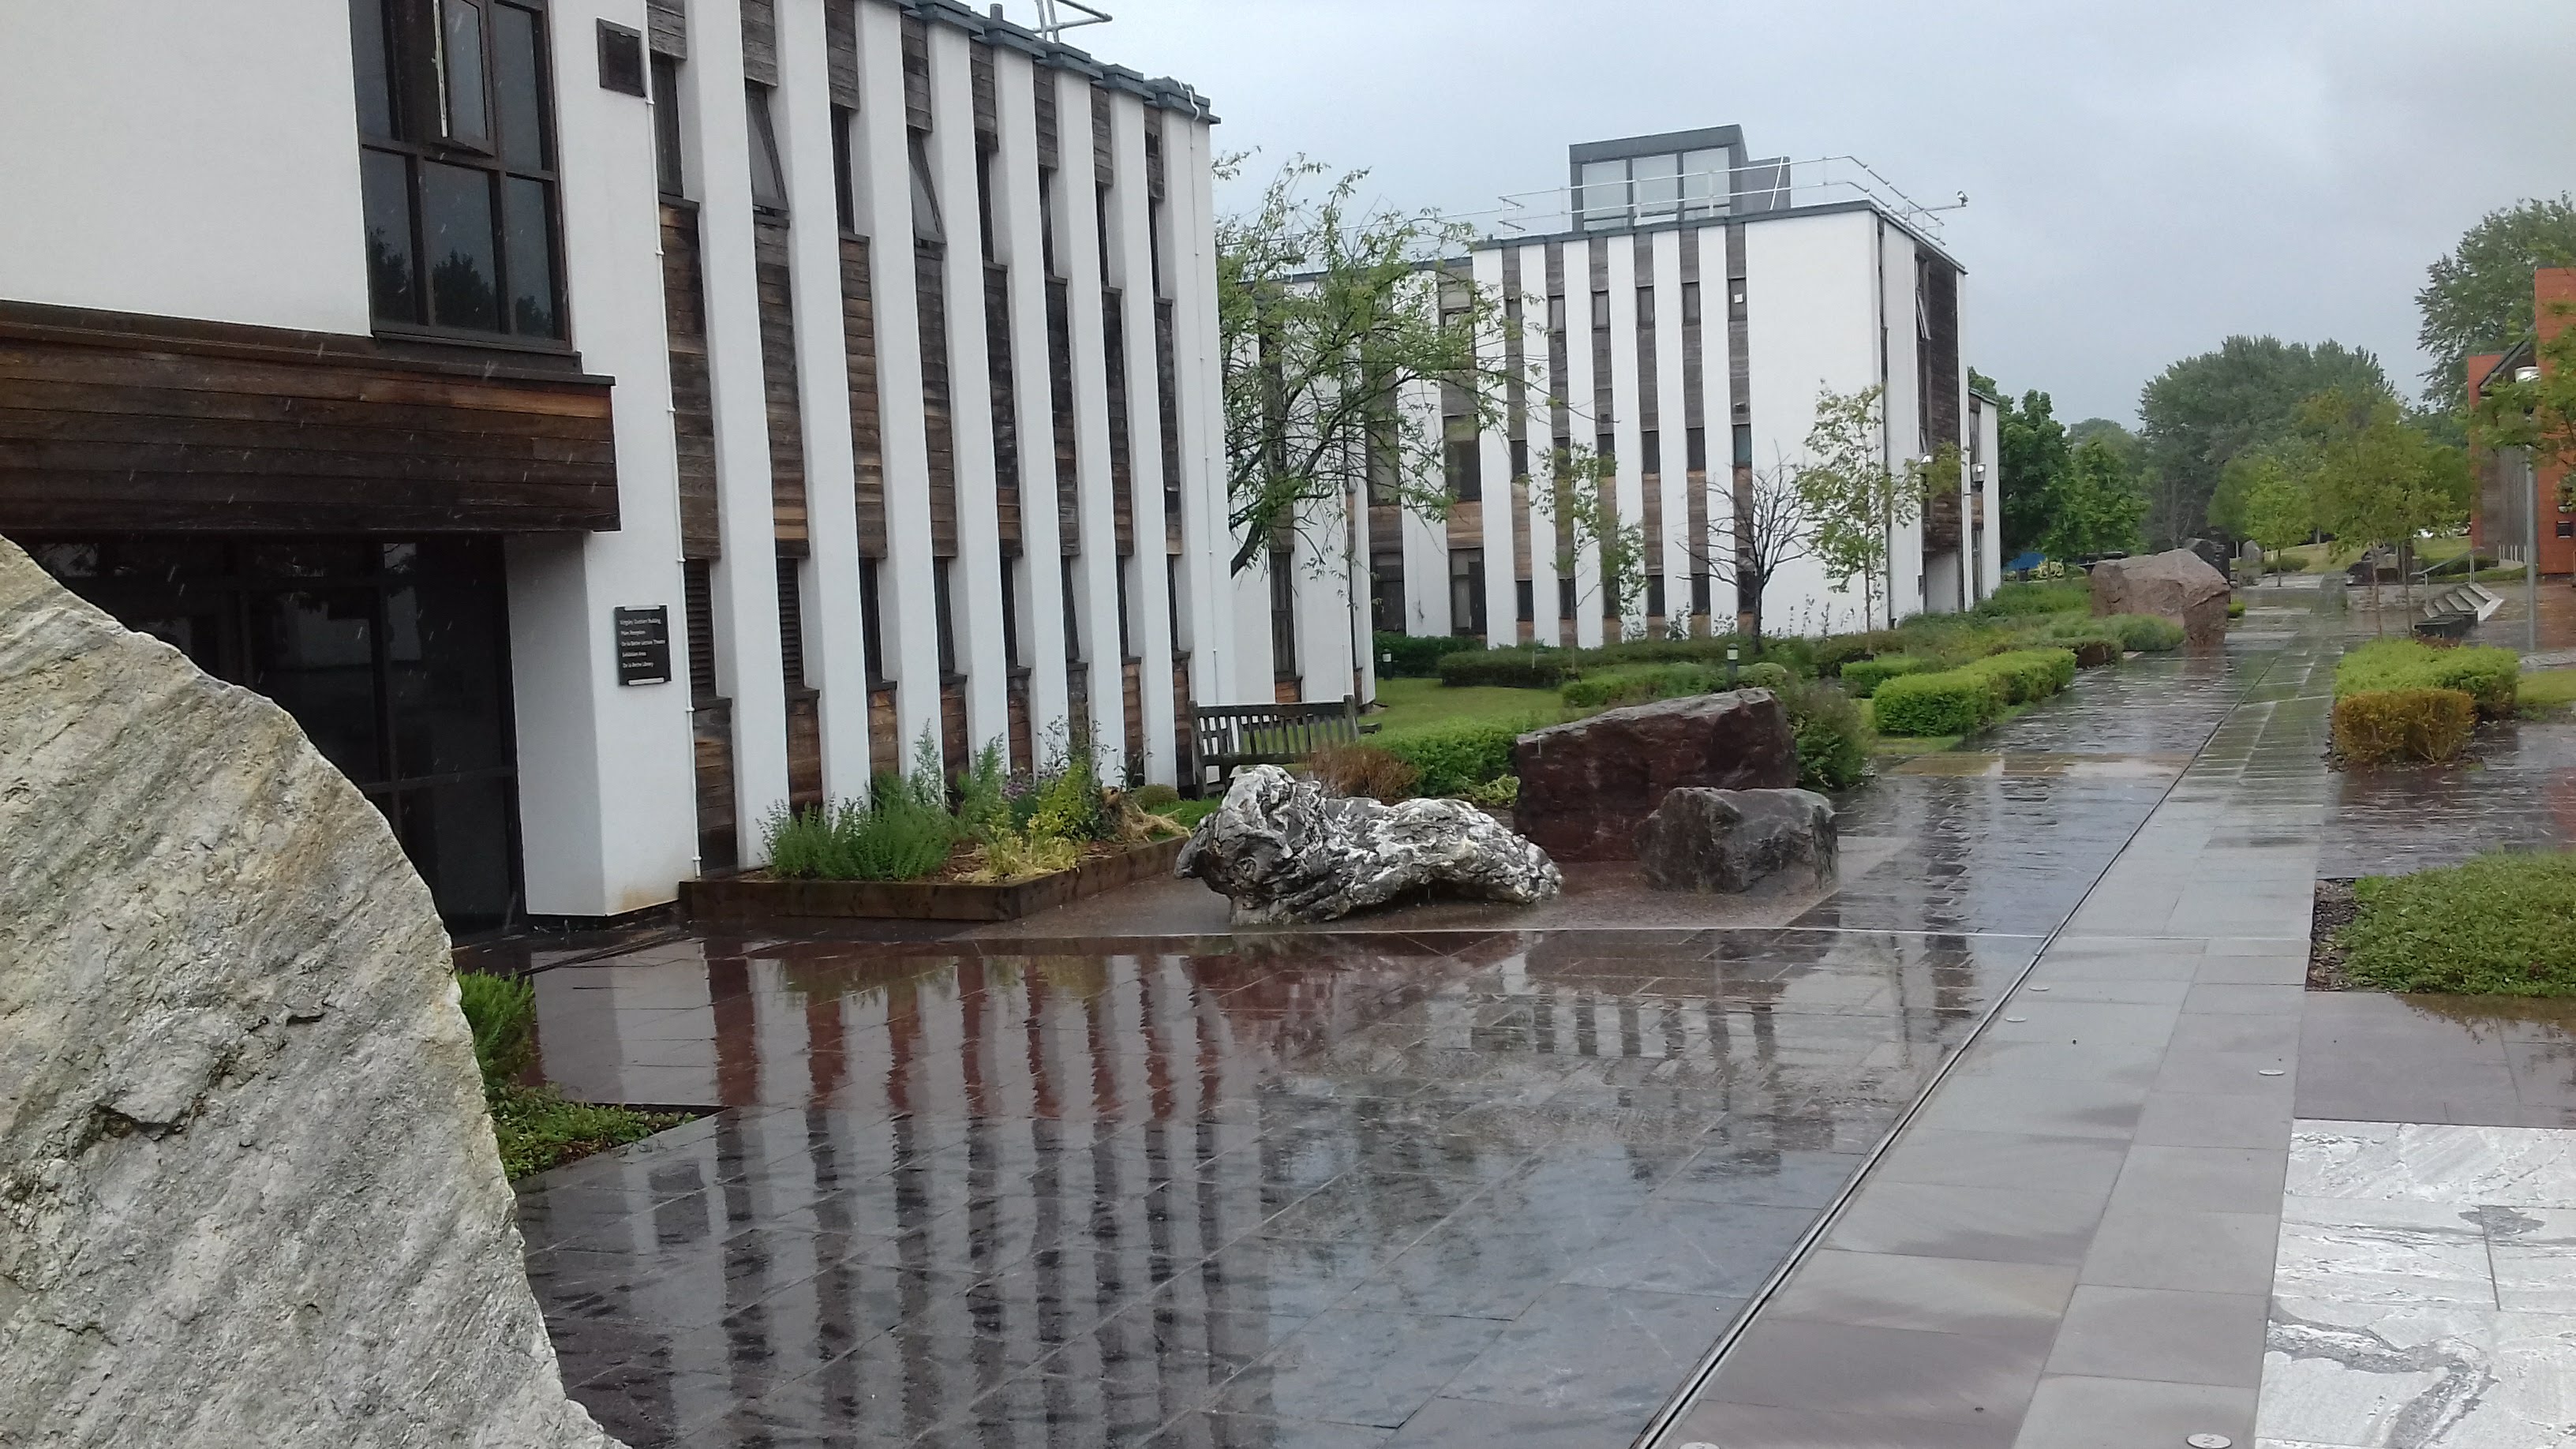
My First Secondment in Durham, including a visit to the british geological survey
Thomas Zengaffinen (ESR13) | @ Durham University, United Kingdom (1 May - 1 August 2019)
 The third chapter of my PhD is modelling the Trænadjupet Slide and its resulting tsunami. The landslide is one of the largest submarine landslides that happened worldwide at ~3000yr BP off the western Norwegian coast, though there is no evidence of tsunami deposits in coastal lakes. Through numerical modelling, I intend to find out how the failure dynamics of the Trænadjupet Slide governed the lack of tsunami generation.
Between May and August 2019 I began my first secondment at Durham University, collecting data for my initial model setup and an explanation for its failure dynamics.
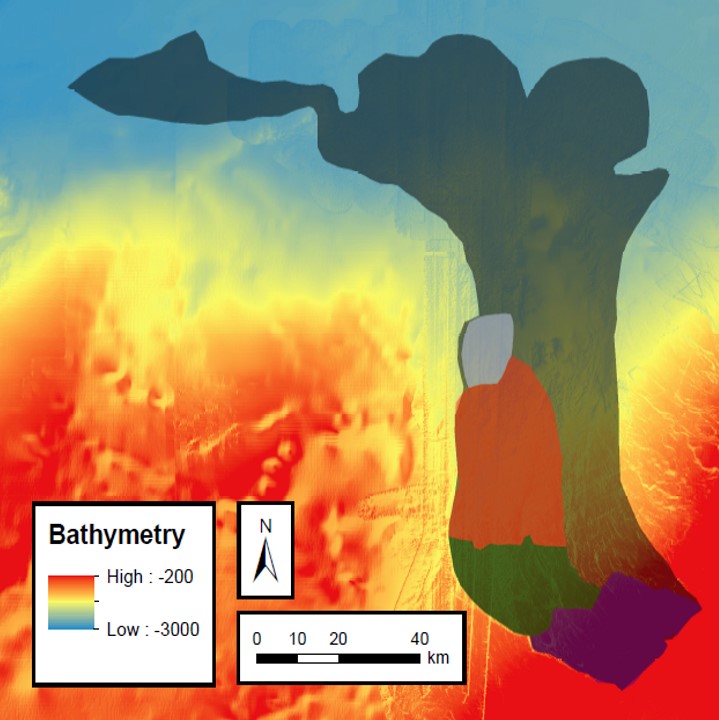
Joshua Allin is the first author of a currently revised scientific paper that deals with geological evidence associated with failure dynamics. Three of many co-authors are Peter Talling, David Tappin, and Edward Pope. Peter Talling and Edward Pope are both based at Durham University, with Peter Talling supervising me during my secondment, and Edward Pope providing me with the bathymetric data of the landslide. David Tappin works in Keyworth at the British Geological Survey (BGS) and is currently carving out supporting arguments on the failure dynamics.
Discussions with Peter Talling about the geological setting and possible failure dynamics served as a good start. After a month in Durham at the beginning of June 2019, I visited David Tappin in Keyworth for two days, where we discussed possible scenarios of the slide failure dynamics by looking at 3D-Multibeam data. He shared his recent findings and analysis so that together with my modelling skills gained in Oslo, I was able to explain to him how we intended to set up the numerical model of the landslide.
During the SLATE midterm meeting in Bremen at the beginning of July 2019, Finn Løvholt, one of my supervisors in Oslo, Peter Talling and I took the opportunity to discuss the progress of my Trænadjupet chapter. We also talked about my second chapter, modelling the 2018 Anak Krakatoa flank collapse and tsunami.
During my stay in Durham, I regularly discussed the findings from the 2018 Anak Krakatoa event with my supervisors Finn Løvholt and Carl Harbitz from NGI, and with Geir Pedersen from the University of Oslo. They advised me on the further steps needed to finish my simulations, analysis, and writing of this second chapter. By the end of my secondment, I had come up with a first paper draft on which Peter Talling gave me fruitful comments concerning the writing.
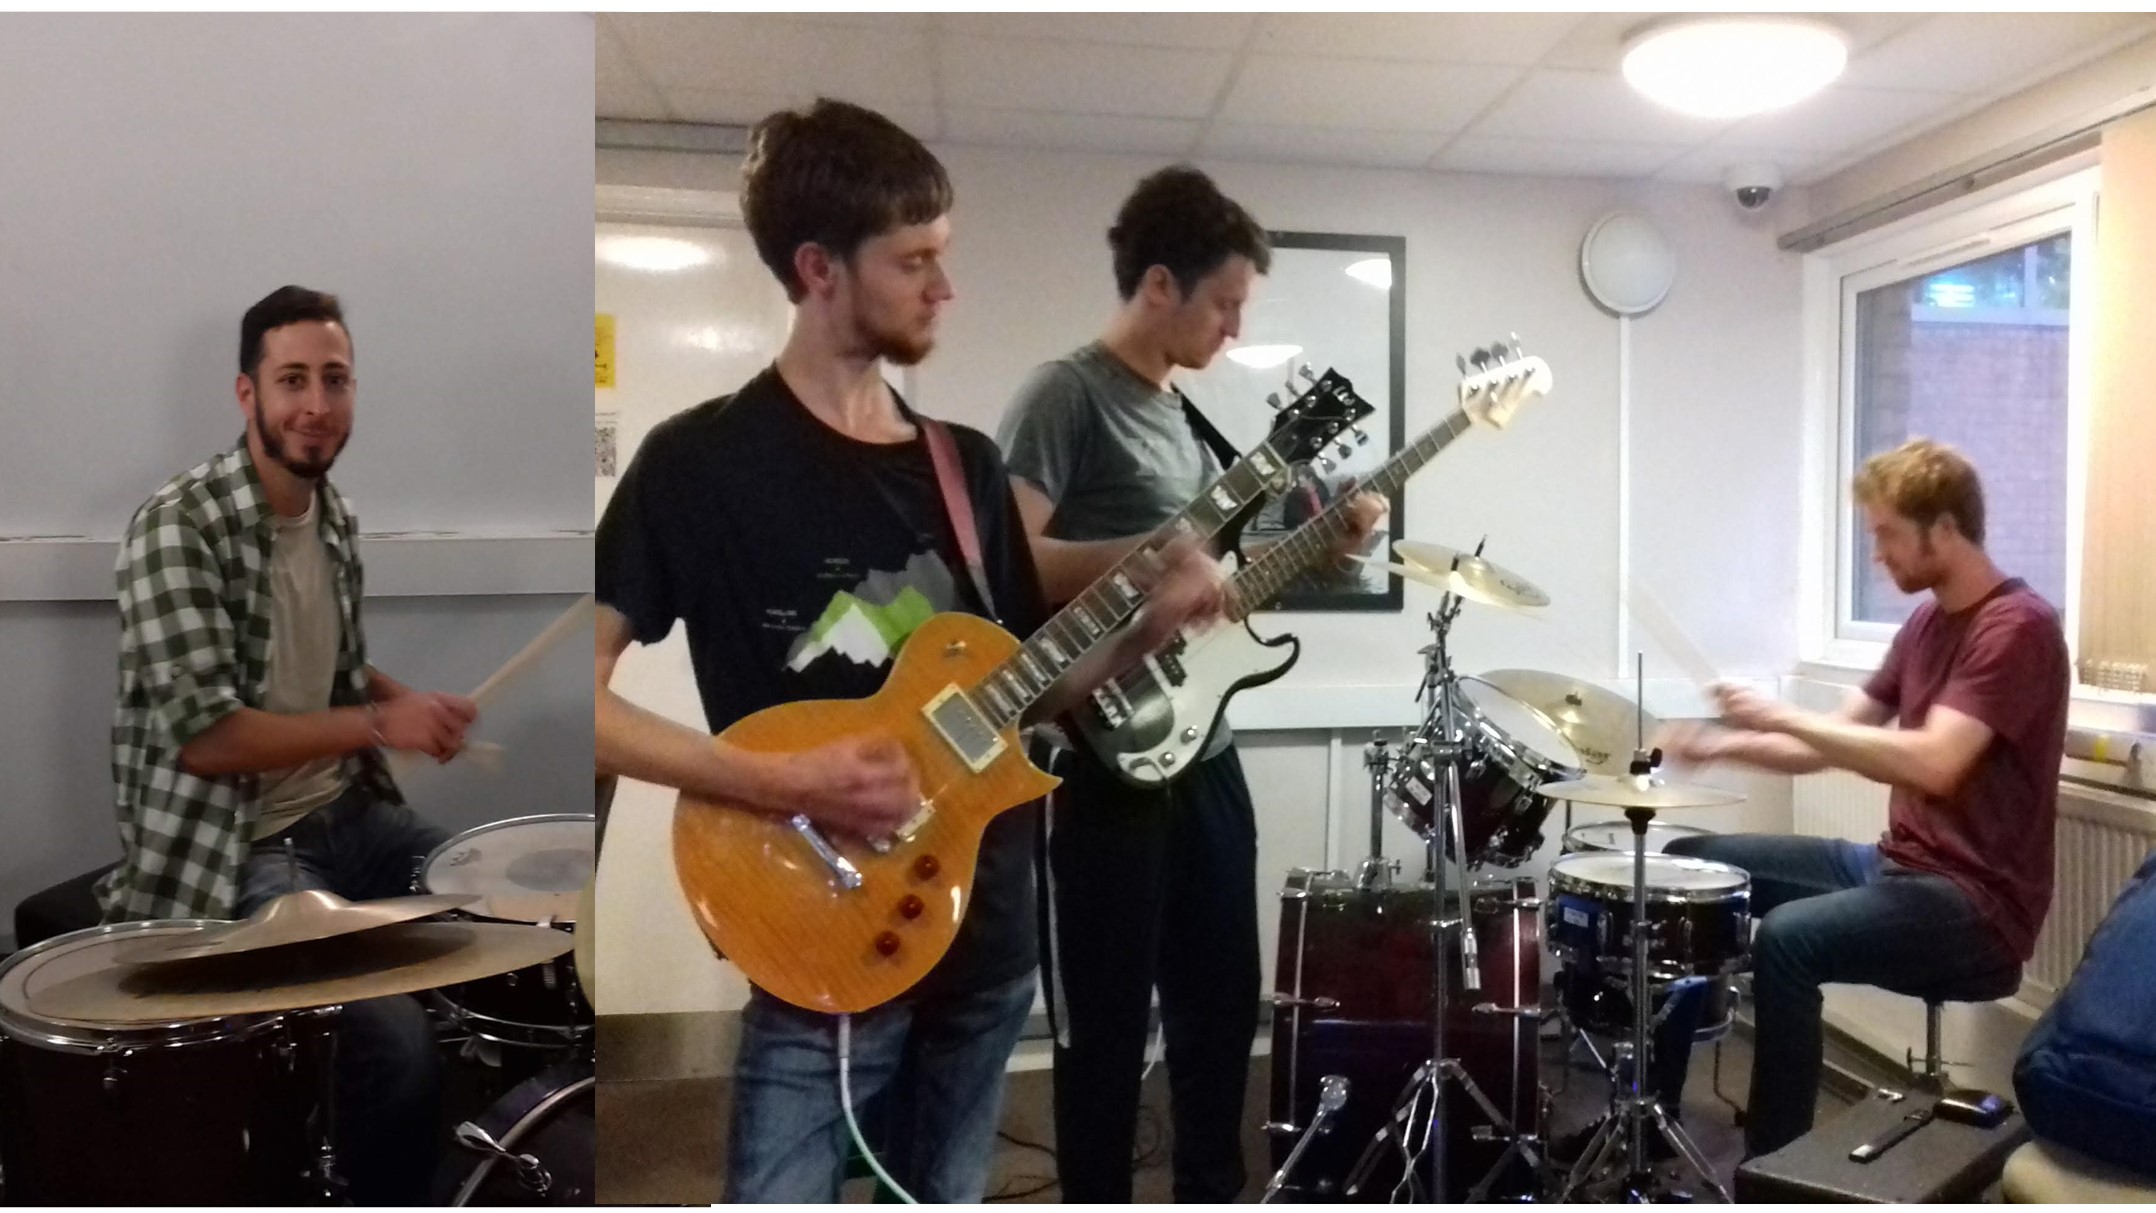
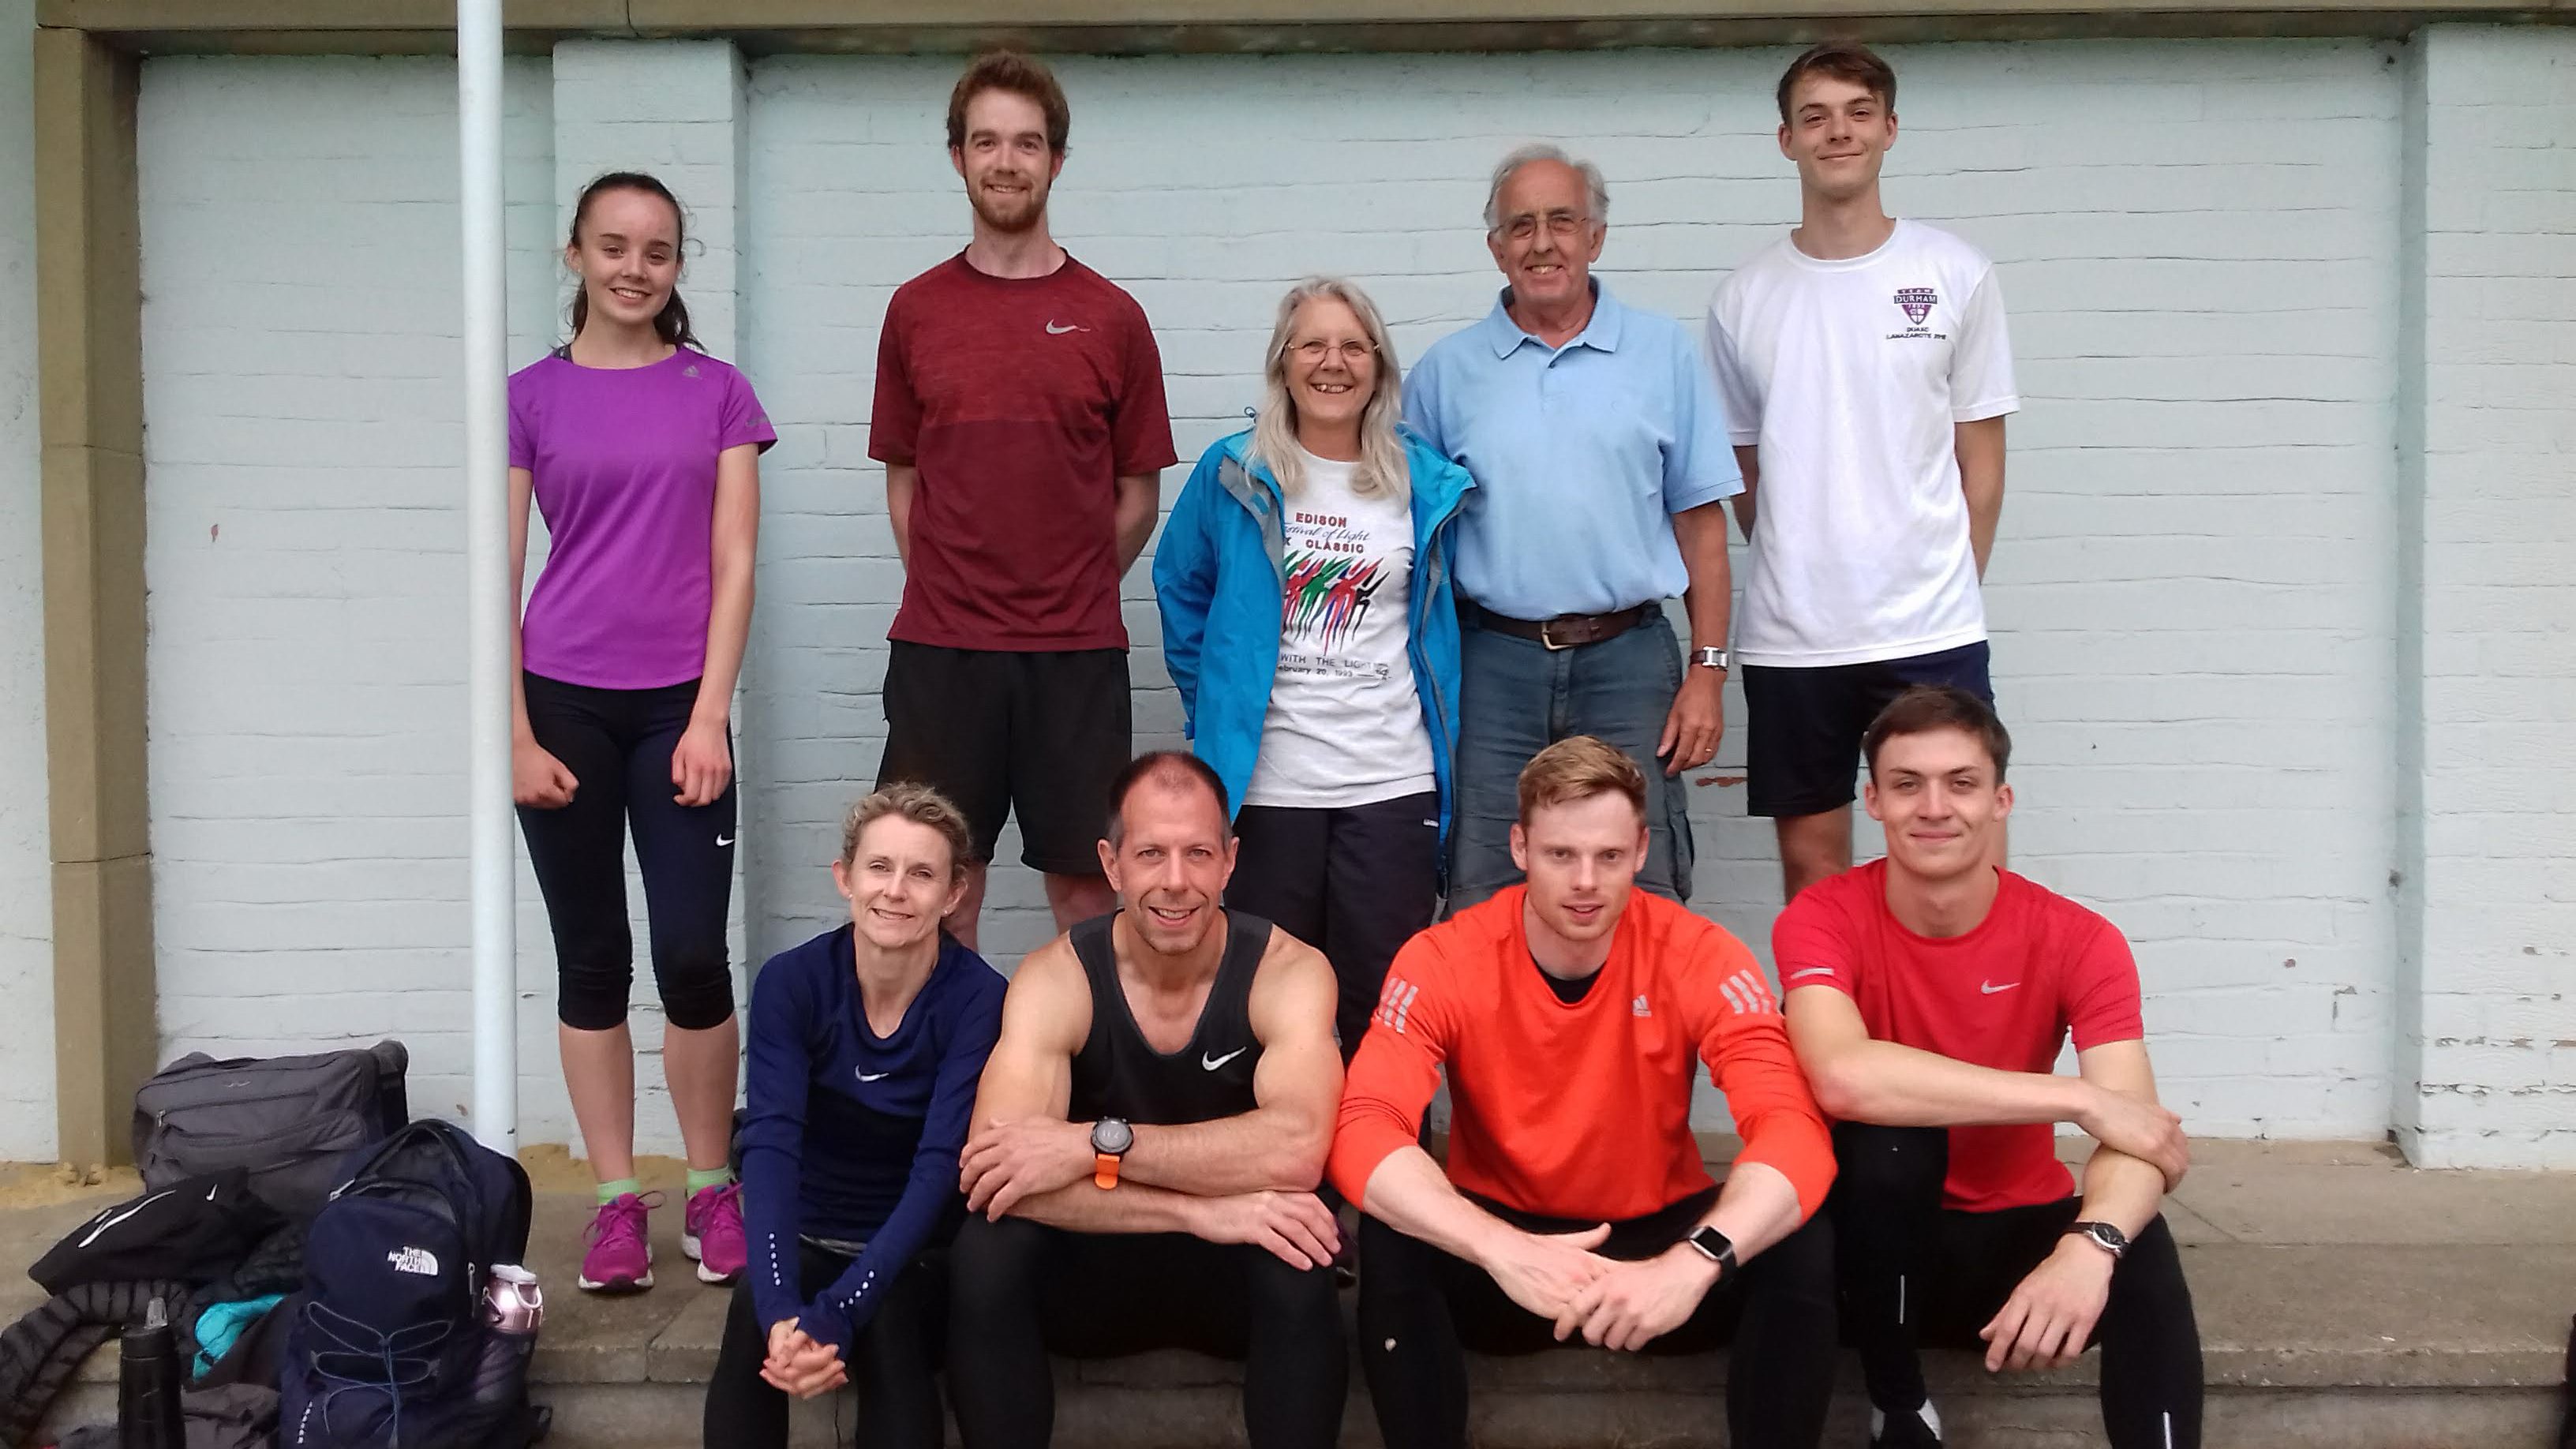
Apart from science, I socialised with my office mates who were seated in the same open-plan office as me in the department of Earth Sciences. After work hours, we spent time together socially. There were several other musicians in the department, and we met weekly for jam sessions. Many students lived in the same part of town as I did, including Kate Heerema, ESR 5, who came back from Oslo in the last week of my secondment in Durham. As a passionate long sprint runner, I joined the running team 'The City Harriers' and had the chance to train with national champions as well as other decent runners.
All in all, my secondment at Durham University was a great opportunity to collaborate and socialise with other great researchers. The bathymetry data provided by Edward Pope, and taking Peter Talling and David Tappin's geological explanations of the failure dynamics into account has been invaluable in the progression of my project. Furthering our geological understanding has made our numerical models much more realistic, so for this, I am very grateful.
Location
The third chapter of my PhD is modelling the Trænadjupet Slide and its resulting tsunami. The landslide is one of the largest submarine landslides that happened worldwide at ~3000yr BP off the western Norwegian coast, though there is no evidence of tsunami deposits in coastal lakes. Through numerical modelling, I intend to find out how the failure dynamics of the Trænadjupet Slide governed the lack of tsunami generation.
Between May and August 2019 I began my first secondment at Durham University, collecting data for my initial model setup and an explanation for its failure dynamics.
Joshua Allin is the first author of a currently revised scientific paper that deals with geological evidence associated with failure dynamics. Three of many co-authors are Peter Talling, David Tappin, and Edward Pope. Peter Talling and Edward Pope are both based at Durham University, with Peter Talling supervising me during my secondment, and Edward Pope providing me with the bathymetric data of the landslide. David Tappin works in Keyworth at the British Geological Survey (BGS) and is currently carving out supporting arguments on the failure dynamics.
Discussions with Peter Talling about the geological setting and possible failure dynamics served as a good start. After a month in Durham at the beginning of June 2019, I visited David Tappin in Keyworth for two days, where we discussed possible scenarios of the slide failure dynamics by looking at 3D-Multibeam data. He shared his recent findings and analysis so that together with my modelling skills gained in Oslo, I was able to explain to him how we intended to set up the numerical model of the landslide.
During the SLATE midterm meeting in Bremen at the beginning of July 2019, Finn Løvholt, one of my supervisors in Oslo, Peter Talling and I took the opportunity to discuss the progress of my Trænadjupet chapter. We also talked about my second chapter, modelling the 2018 Anak Krakatoa flank collapse and tsunami.
During my stay in Durham, I regularly discussed the findings from the 2018 Anak Krakatoa event with my supervisors Finn Løvholt and Carl Harbitz from NGI, and with Geir Pedersen from the University of Oslo. They advised me on the further steps needed to finish my simulations, analysis, and writing of this second chapter. By the end of my secondment, I had come up with a first paper draft on which Peter Talling gave me fruitful comments concerning the writing.
Apart from science, I socialised with my office mates who were seated in the same open-plan office as me in the department of Earth Sciences. After work hours, we spent time together socially. There were several other musicians in the department, and we met weekly for jam sessions. Many students lived in the same part of town as I did, including Kate Heerema, ESR 5, who came back from Oslo in the last week of my secondment in Durham. As a passionate long sprint runner, I joined the running team 'The City Harriers' and had the chance to train with national champions as well as other decent runners.
All in all, my secondment at Durham University was a great opportunity to collaborate and socialise with other great researchers. The bathymetry data provided by Edward Pope, and taking Peter Talling and David Tappin's geological explanations of the failure dynamics into account has been invaluable in the progression of my project. Furthering our geological understanding has made our numerical models much more realistic, so for this, I am very grateful.
Location
- Durham University, UK
@ Vienna, Austria (07 – 12 April 2019) | 2019-07-23
A GUIDE AROUND EGU 2019
ESR1, ESR 2, ESR 3, ESR 4, ESR 5, ESR 6, ESR 7, ESR 8, ESR 9, ESR 12, ESR 13, ESR 14, ESR15 | @ VIENNA, AUSTRIA (7-12 April 2019)
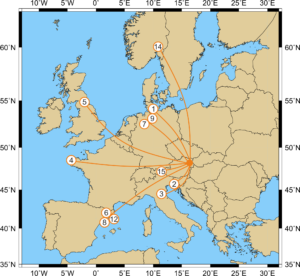
“The EGU General Assembly 2019 was a great success with 5,531 oral, 9,432 poster, and 1,287 PICO presentations that were attended by 16,273 scientists from 113 countries” (Copernicus Meetings, 2019).
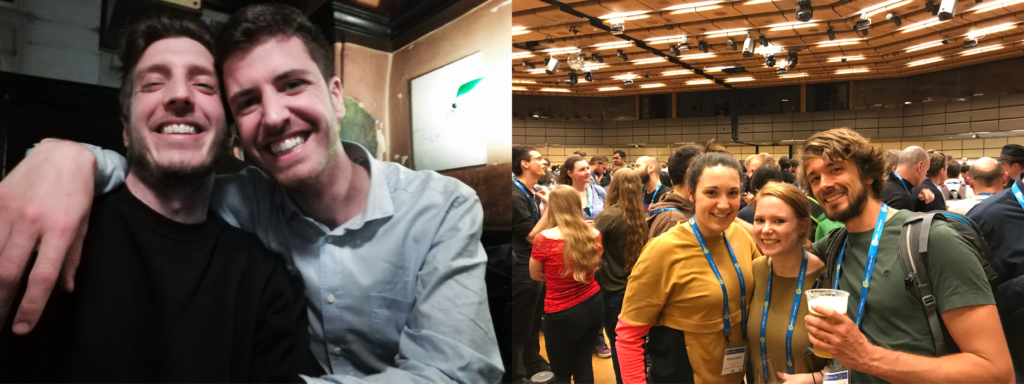
SLATE was well represented with 12 PhD candidates, PIs (Achim Kopf, Michael Clare, Carl Harbitz, Finn Lovholt, Michael Strasser) and Aggeliki Georgiopoulou from the advisory board presenting their work.
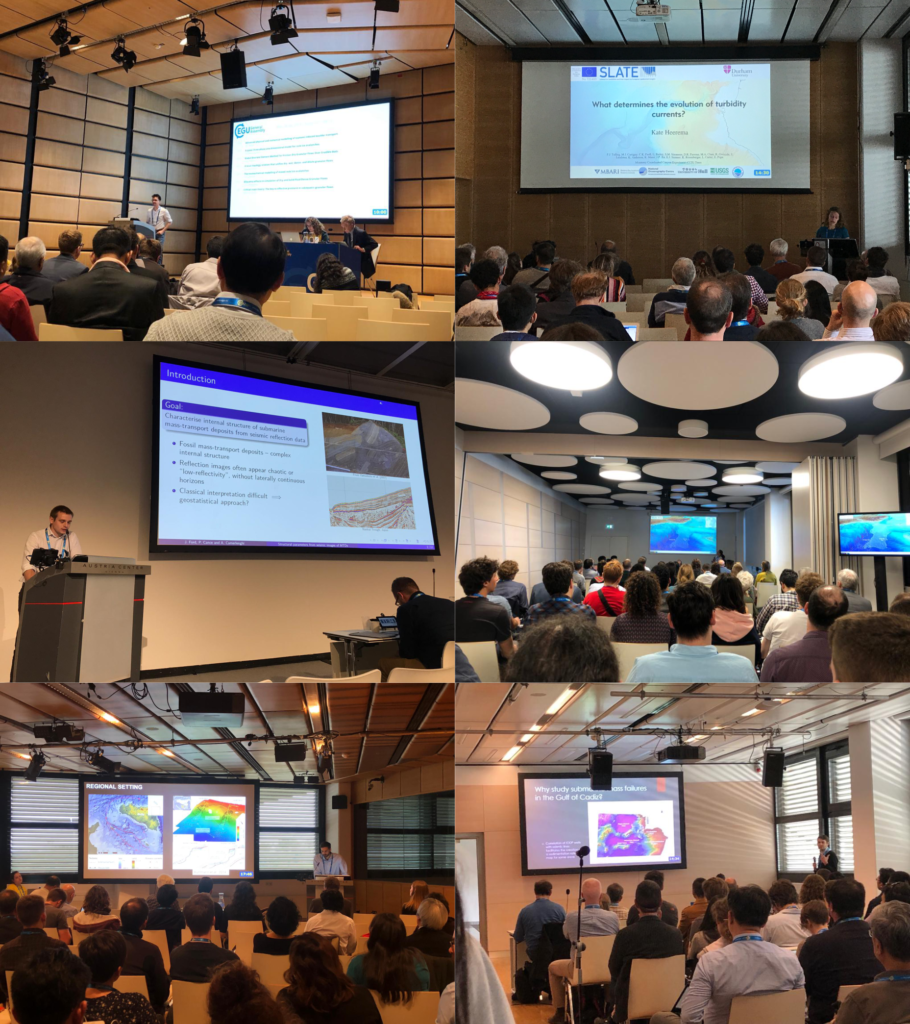
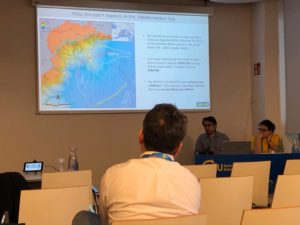
 Presenting our work
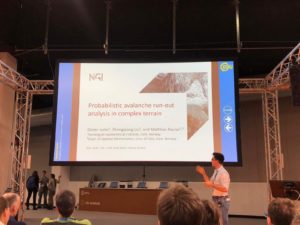
Rachel, Jonathan, Tugdual, Shray, Kate, William and Matthias drew crowds of people into the lecture rooms with their amazing presentations. They spoke on a variety of topics; covering different aspects of turbidites and their evolution, contourites and submarine landslides.
 “I was very happy to be able to present my work at this conference, as it gives an occasion to present our work in front of a wide audience with very diverse backgrounds. I came out with very good feedback and advice for my work.” (Tugdual Gauchery, ESR 3)
„It was my first time at the EGU and it was overwhelmingly large. I had the opportunity to talk to several researchers after my talk – it is always good to get feedback on both the positive and negative parts of ones research.” (Shray Badhani, ESR 4)
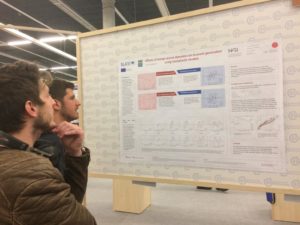
Davide, Ting-Wei, Stefano, Ricarda and Maddalena presented their work in the poster sessions and attracted a lot of people.
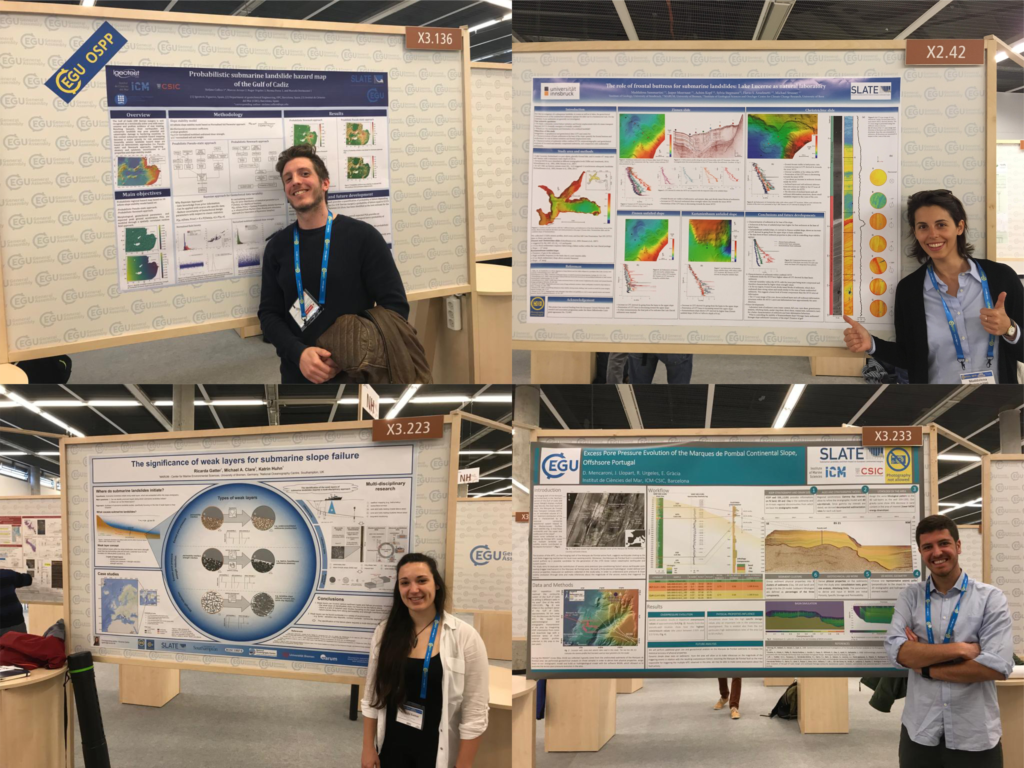
“Presenting a poster at a conference like EGU is a great learning opportunity for any early career scientist. On one hand, I had the chance to discuss my research with people working in the same research field and to meet scientists I had only known from reading their papers. What surprised me the most, however, were the questions I got from scientists specialized in completely different fields, looking at my project from a prospective I do not usually consider. People who were just randomly walking around posters asked me the most challenging questions, highlighting issues that I never considered before, but that helped me to have a more complete understanding of what I am studying.” (Davide Mencaroni, ESR 6)
And learning new thingsApart from presenting our own work, we took the opportunity to learn more about work from outside our own fields. Alongside the traditional poster and oral presentations, EGU also hosts so called “PICO” presentations (Presenting Interative COntent) and short courses on more general topics in science.
“One thing that I really enjoyed about EGU were the PICO sessions. PICOs start with quick-fire two minute presentations from each researcher to briefly introduce their topic and state their main conclusions. After, everyone moves across to the interactive area, where each presenter has their own workstation and large screen. This really facilitates discussion and allows for more flexibility that a standard poster or talk. For me, the PICO sessions are a great way to be introduced to an unfamiliar area, because the results are presented up front and you get to see a rapid cross section of the state-of-the-art in a particular field.” (Jonathan Ford, ESR 2)
“It was a great opportunity to get some insights from overlapping, but vastly different, fields. For instance to see what the current state of research in Powder Snow Avalanches is, or to get some background knowledge on numerical modelling in turbidity currents as preparation for my secondment at NGI.” (Kate Heerema, ESR 5)
“One of the most exciting sessions I attended was on the recent tsunami events in Sulawesi and West Java (Krakatao), Indonesia (Blog). Although most of the group seemed to agree that these tsunami events were, in fact, submarine landslide-related, there was some surprisingly lively pushback from at least one seasoned researcher. I think the overall tsunami community seems to be experiencing a small paradigm shift in how they think about tsunami hazards. I also enjoyed stopping by different poster sessions related to tsunami hazards and had some great networking conversations with a group of researchers from Singapore about their work and how it relates to some tsunami survey work that I previously did as a master’s student” (William Meservy, ESR 12)
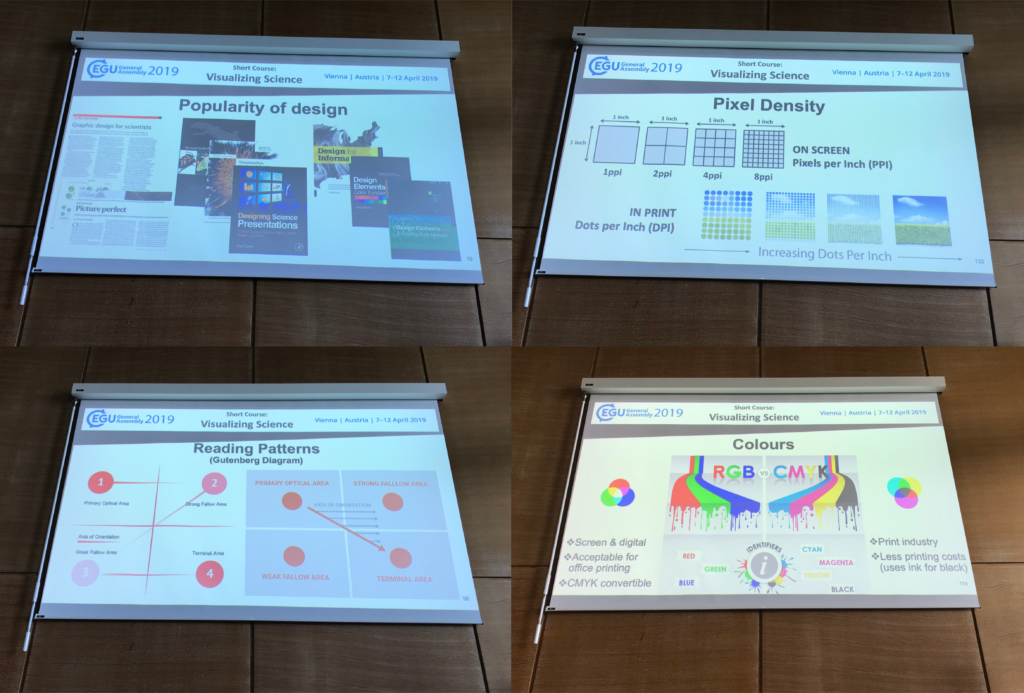
“I went to three courses, of which I especially liked the “Visualizing Science” course. I think we often forget how important it is to present our research to other scientists, as well as to the general public.” (Ricarda Gatter, ESR 9)
“The quantity and variety of soft skill courses available at the EGU undoubtedly adds value to the conference. I attended a course about communicating science with the general public and enjoyed hearing different perspectives about what effective communication looks like, and how that can take different forms. One point that stood out was the value of knowing when it is worthwhile to get the assistance of people who are trained in communication, such as journalists, to communicate significant results.” (Rachel Barrett, ESR 1)
Need help to find your way around? - use the EGU AppFinding your way around a big conference such as EGU can be difficult. Luckily, there was an app available in which you could find all the contributions and put together your personal programme. In addition, we kept everybody up to date with our own contributions via Twitter.
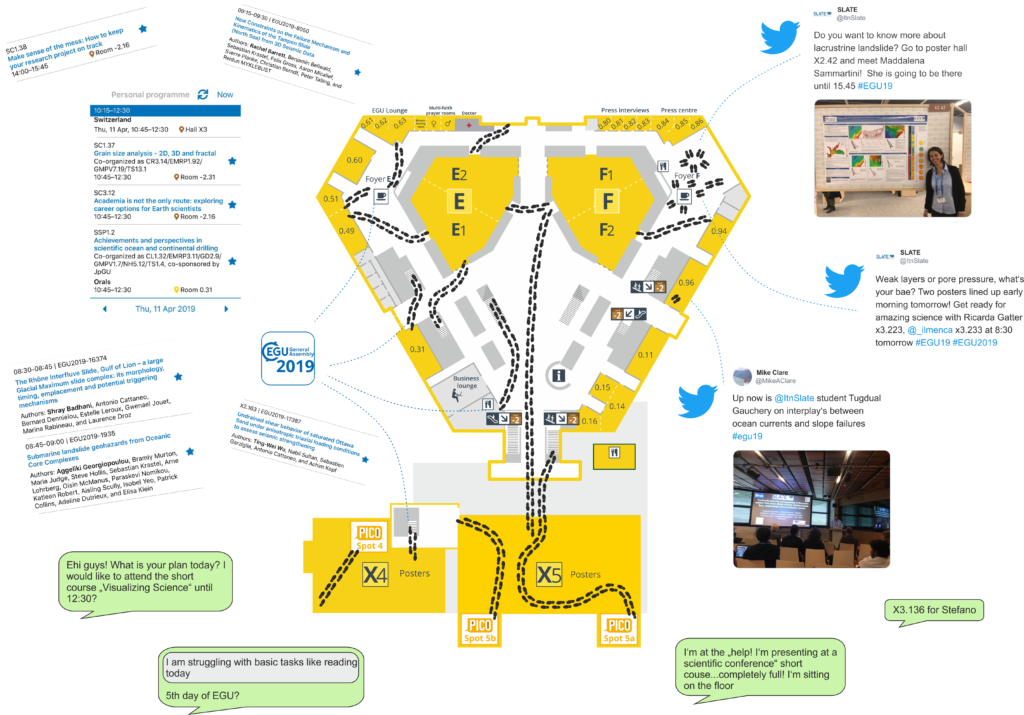
“I knew that EGU is the most important Geoscience conference in Europe, but I didn’t expect something like this. It was difficult not to be impressed by the amount of different topics and talks, but above all, I was struck by the hundreds of posters that everyday are hanging in these huge rooms.” (Maddalena Sammartini, ESR 15)
To sum it up“I was honestly impressed by the EGU conference. It was the perfect environment to discuss a wide range of research topics and learn about other researchers’ PhD experiences.” (Stefano Collico, ESR 8)
“It is such a great international experience. I even met my friends from my home university in India. I am already looking forward to EGU2020.” (Shray Badhani, ESR 4)
“One of the highlights of the experience for me was that I was lucky enough to be able to bring my wife and kids along to explore Vienna. In the evenings, we were able to walk in the city together and eat a lot of goulash and Viennese chocolate cake” (William Meservy, ESR 12)
“EGU is an essential event for every geoscientist working Europe. It is the perfect opportunity to meet new people with common interests, present the latest progress of your work, get valuable feedback and to foster old friendships” (Matthias Rauter, ESR 14)
EGU - Let's meet again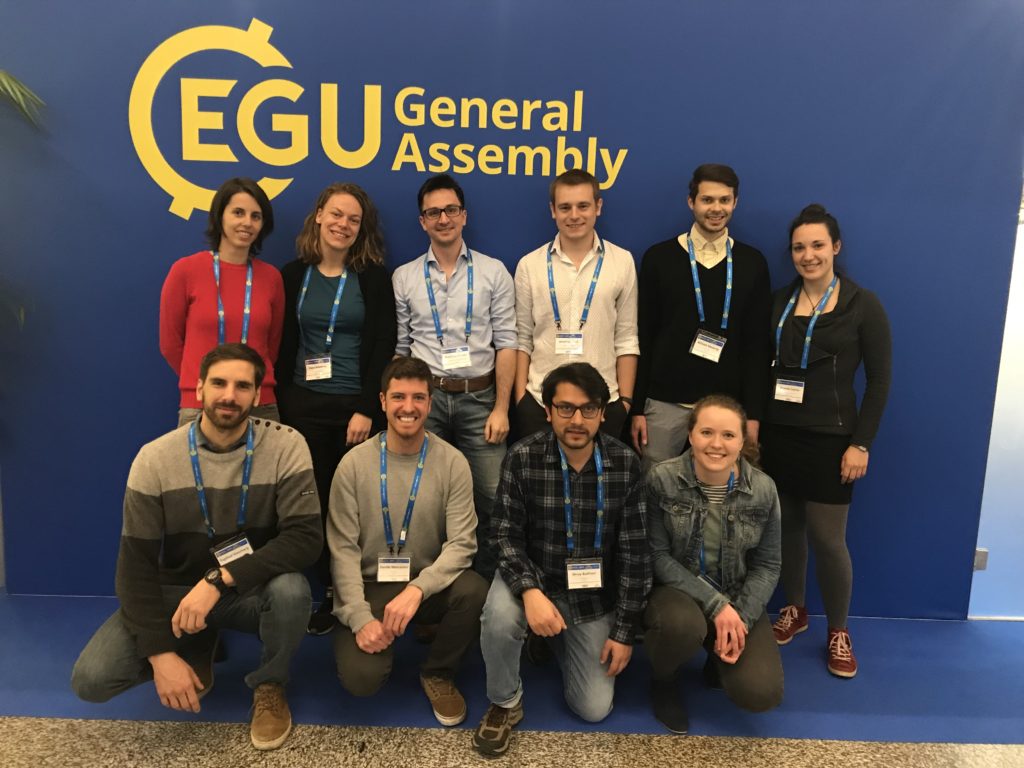 Location
- Vienna, Austria
 Conference Schedule
SLATE participants
ESRs:
Conference Schedule
SLATE participants
ESRs:
- R. Barrett, ESR1 [Talk]
- J. Ford, ESR2 [Talk]
- T. Gauchery, ESR3 [Talk]
- S. Badhani, ESR4 [Talk]
- K. Heerema, ESR5 [Talk]
- D. Mencaroni, ESR6 [Poster]
- T-W Wu, ESR7 [Poster]
- S. Collico, ESR8 [Poster]
- R. Gatter, ESR9 [Poster]
- W. Meservy [Talk]
- T. Zengaffinen, ESR13 [Poster]
- M. Rauter, ESR14 [Talk]
- M. Sammartini, ESR15 [Poster]
- A. Kopf, PI of ESR7 [Poster]
- M. Clare, PI of ESR10 [PICO]
- C. Harbitz, PI of ESR13
- F. Løvholt, PI of ESR14 [Poster]
- F. Løvholt, PI of ESR14 [Convener]
- M. Strasser, PI of ESR15
- A. Georgiopoulou, Advisory Board [Talk]
Let's get muddy! | 2018-10-09
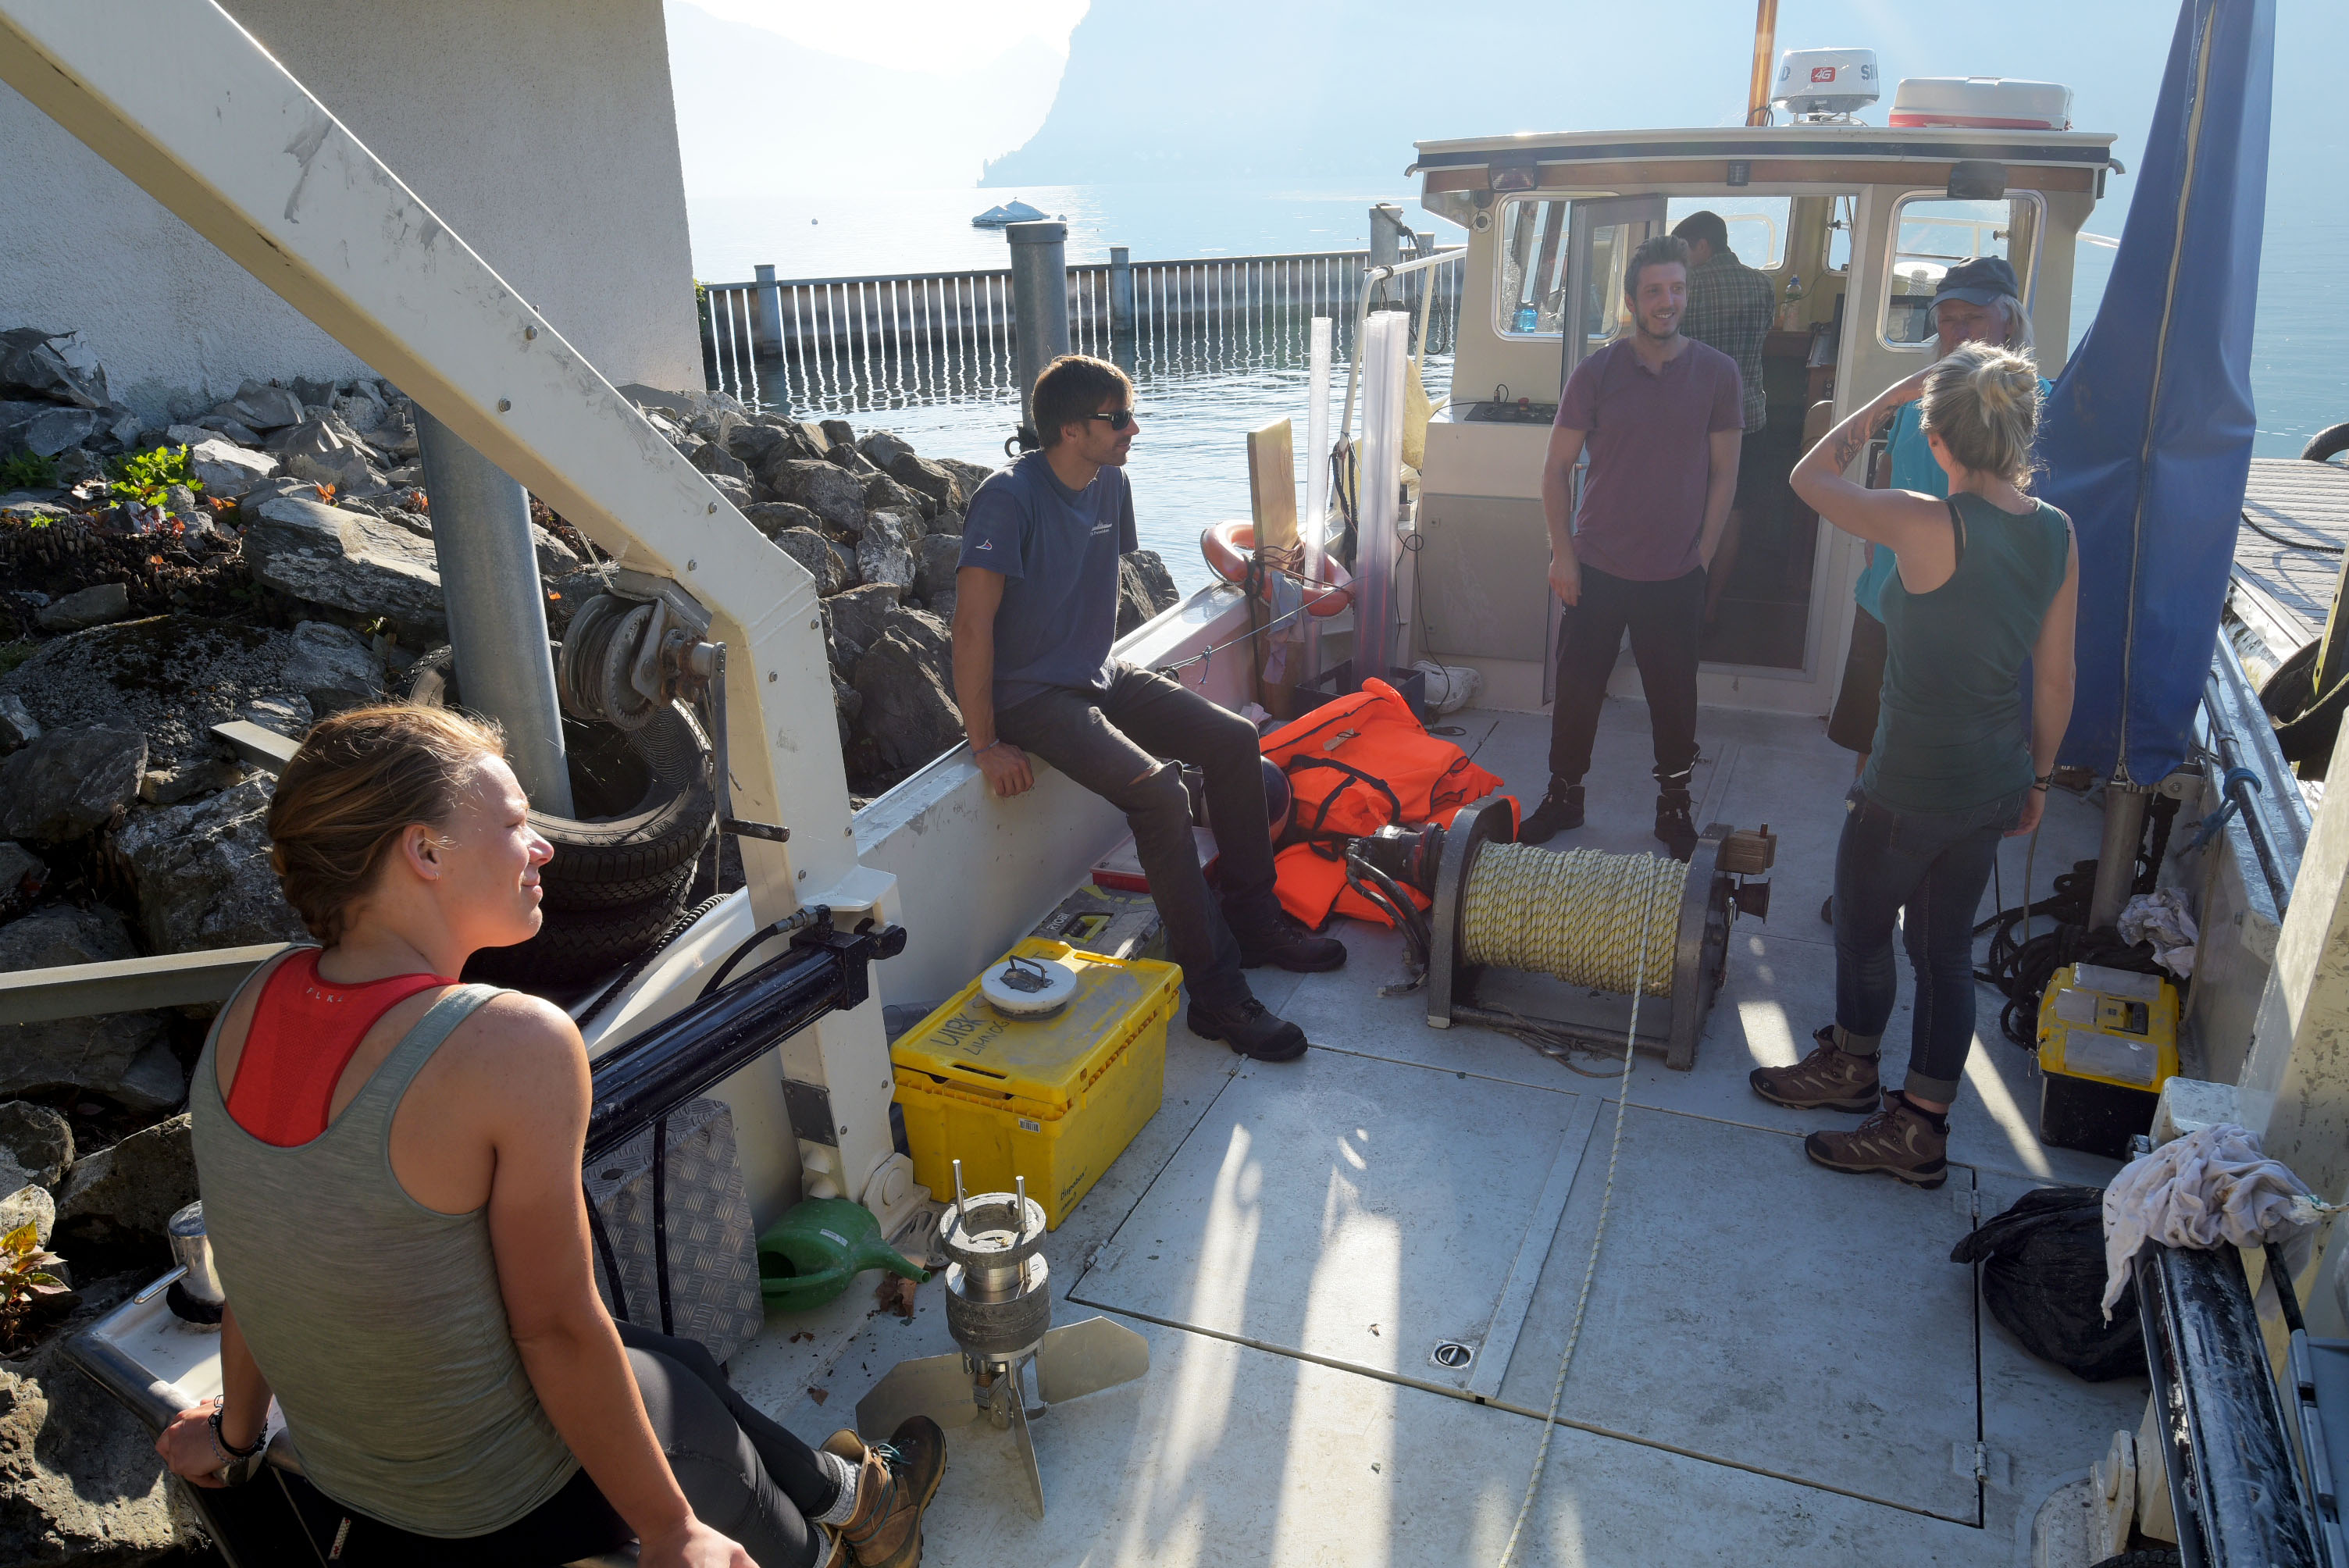
LAKE LUCERNE FIELD TRIP - LET'S GET MUDDY!
Rachel Barrett (ESR 1) , Thomas Zengaffinen (ESR 14), Matthias Rauter (ESR 15) | @ Lake Lucerne, Switzerland (3 October 2018)
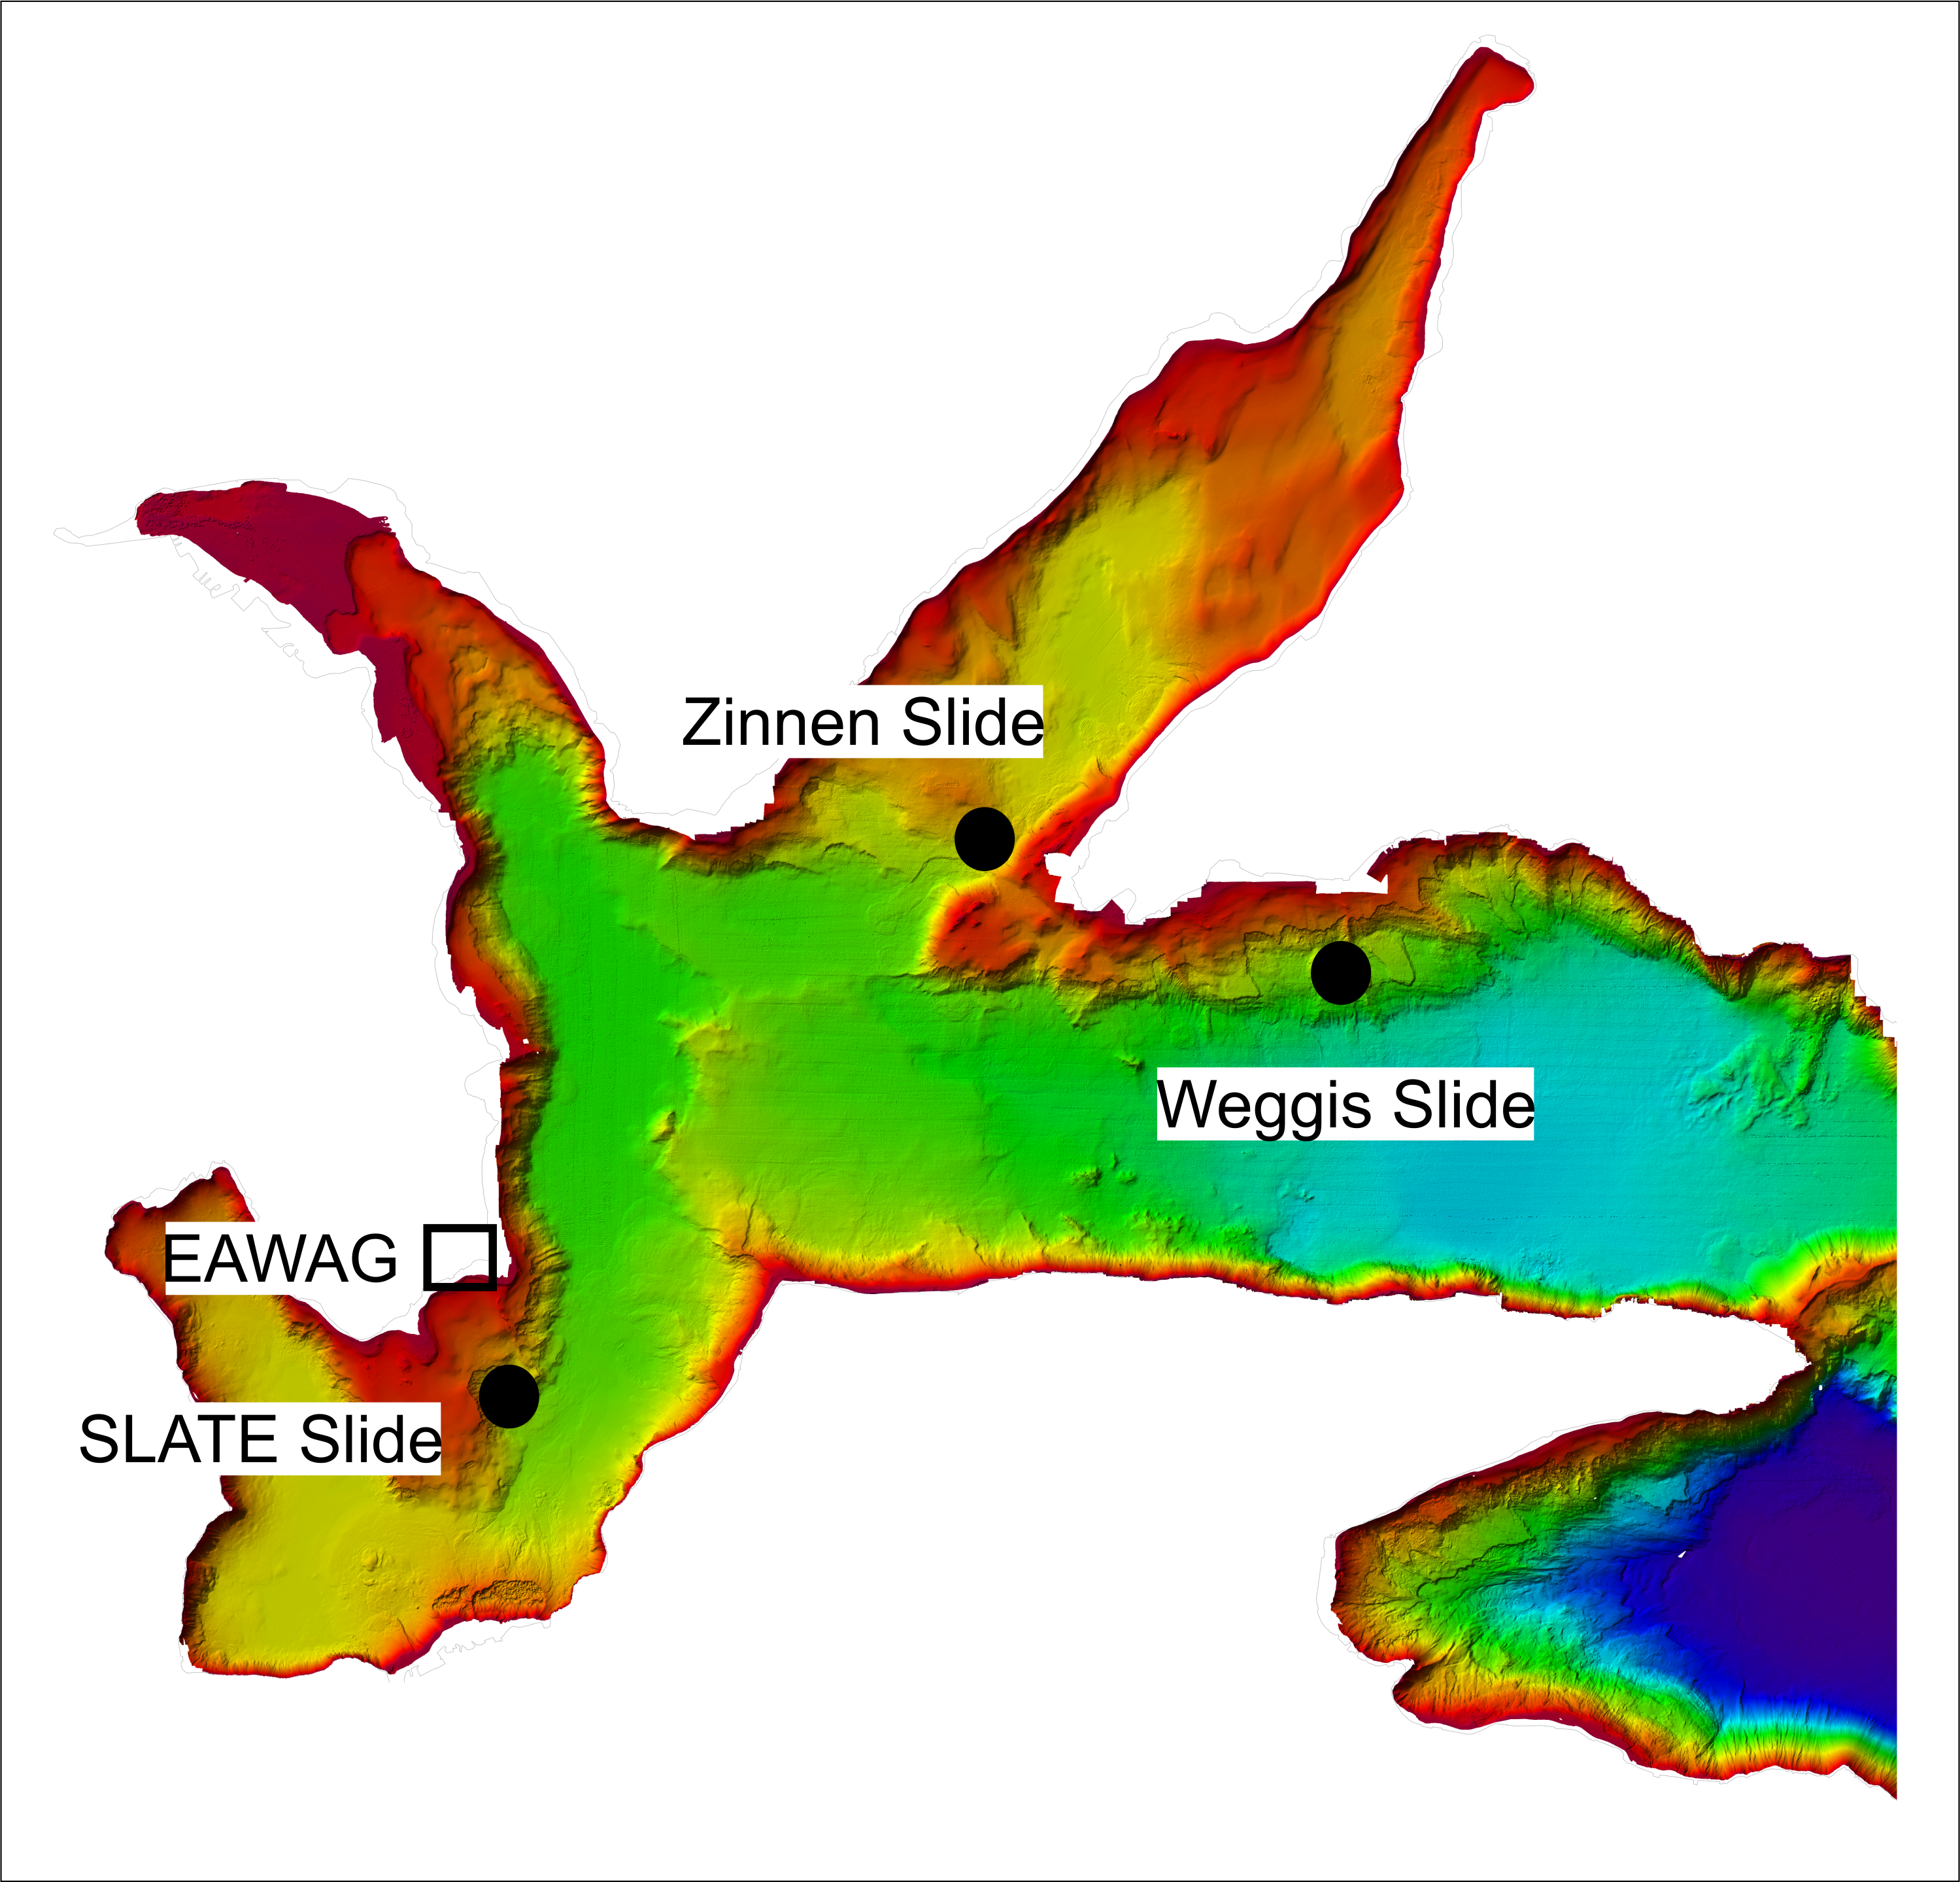
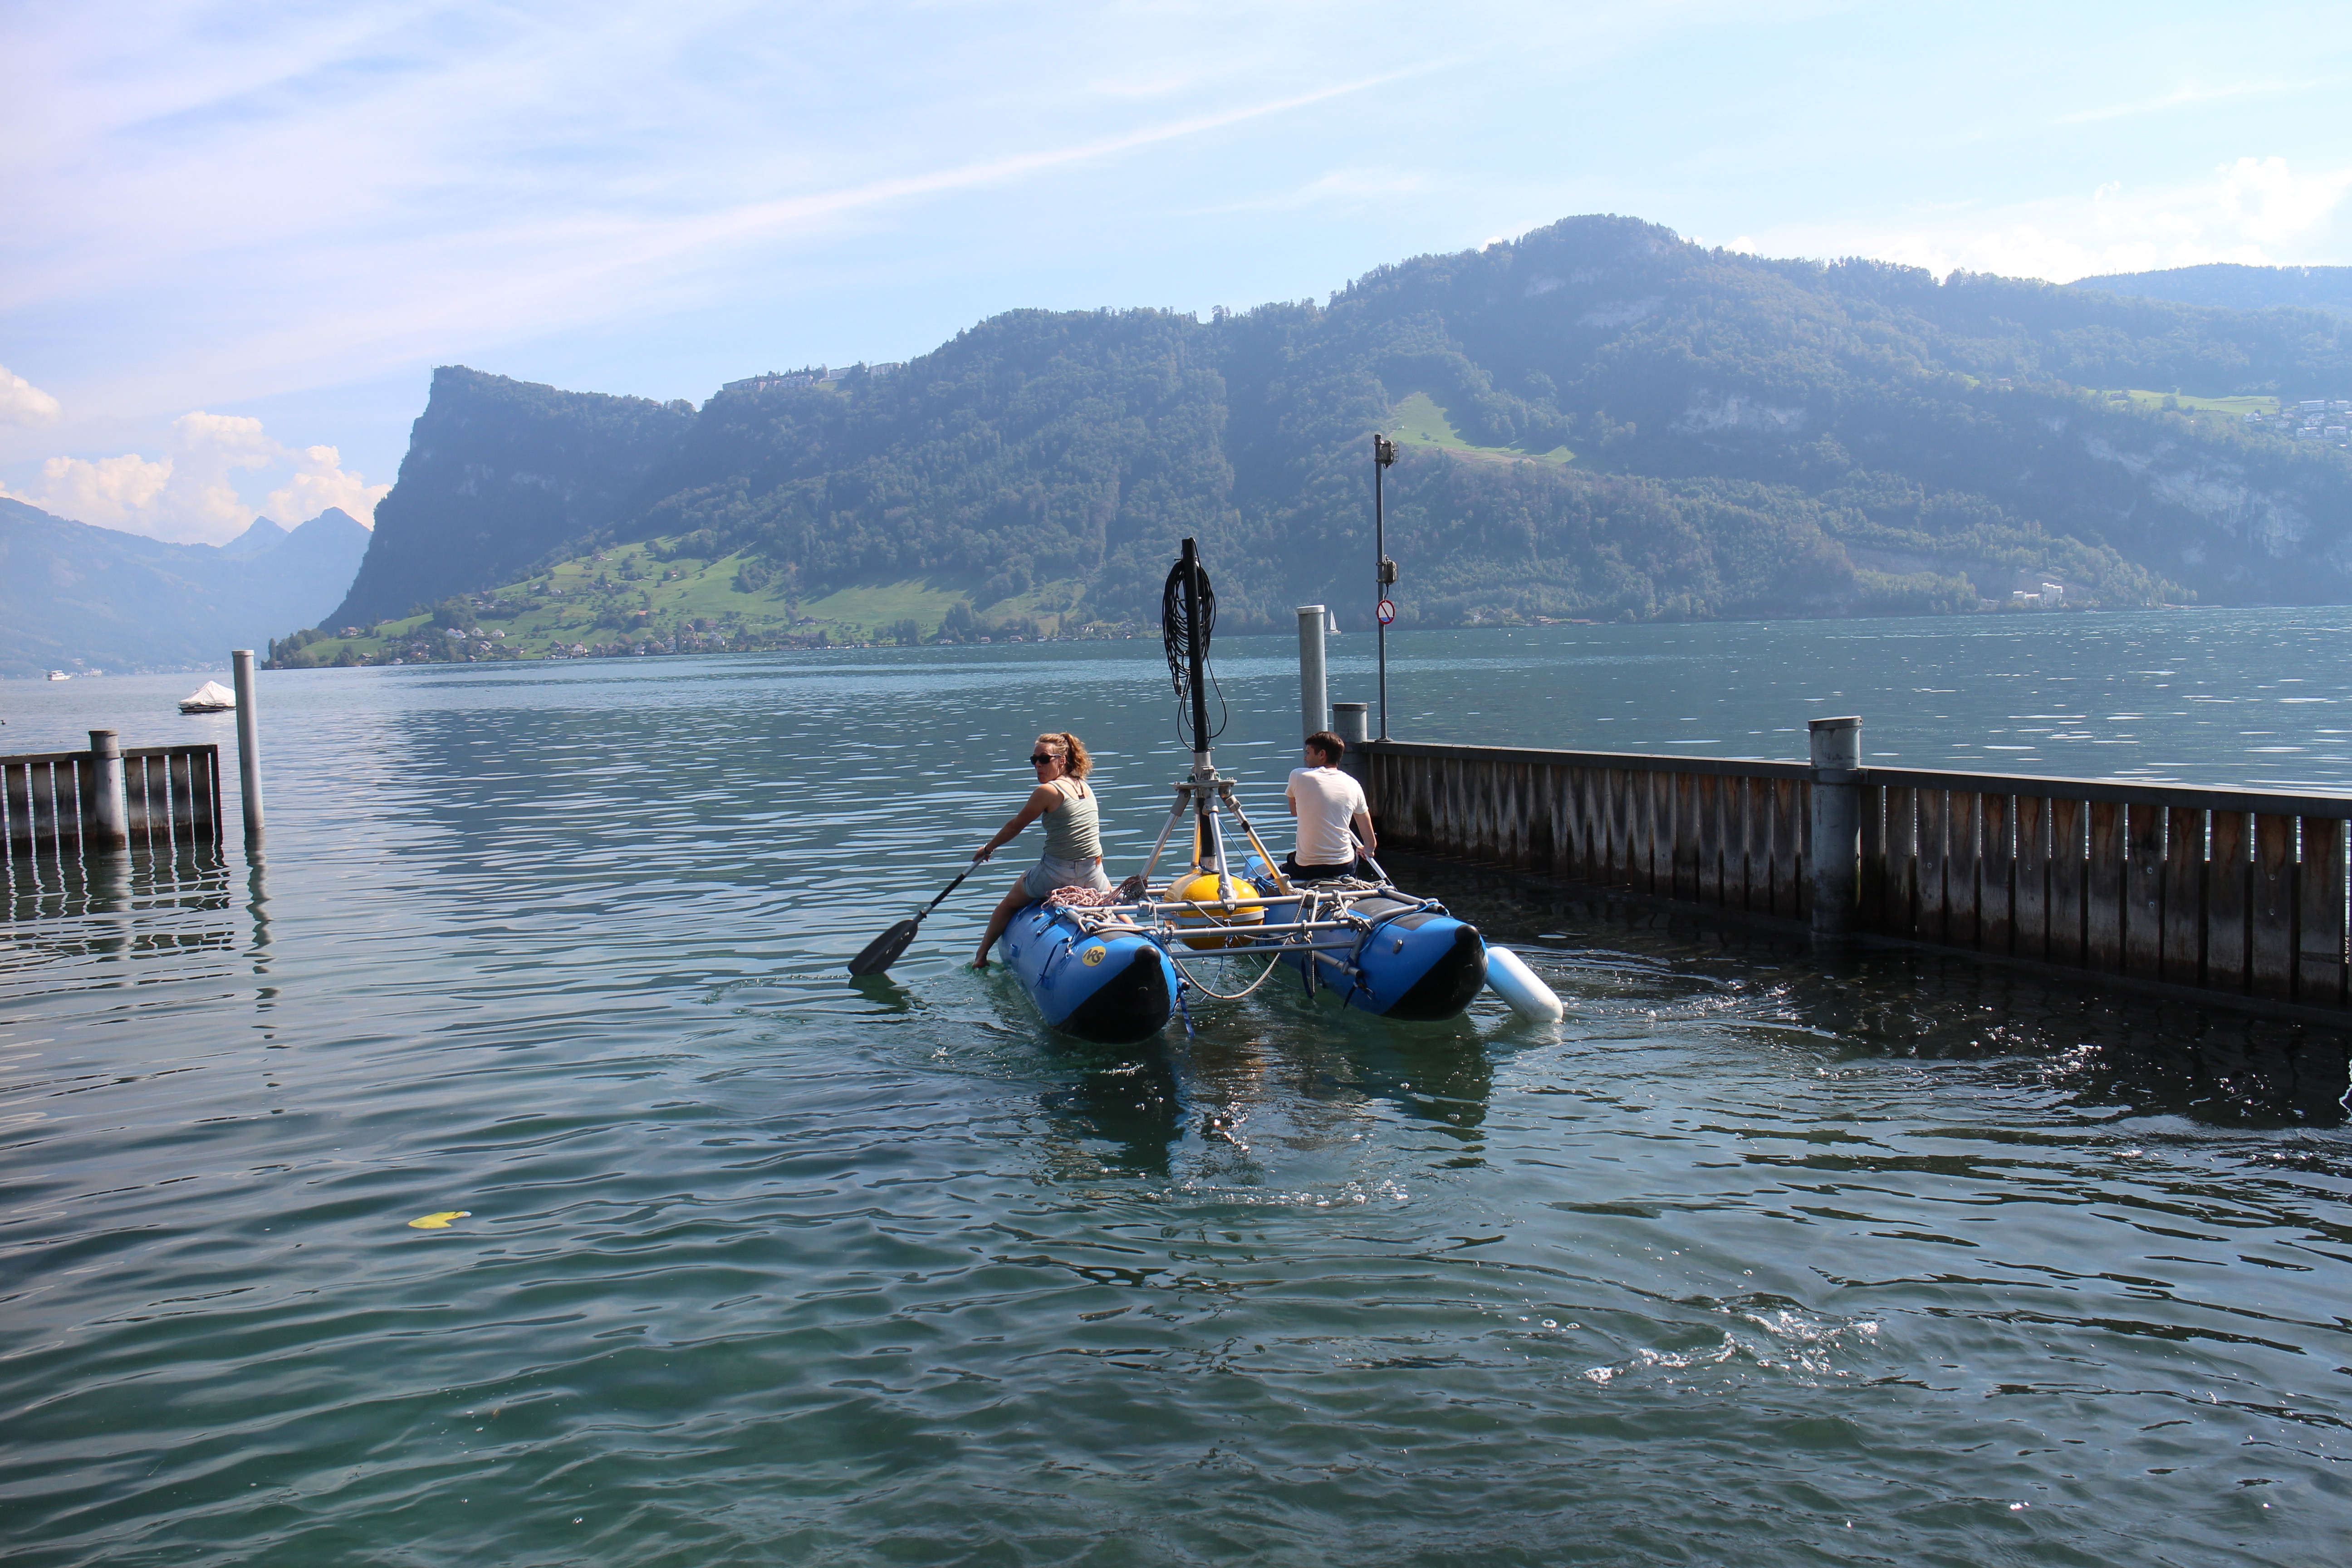
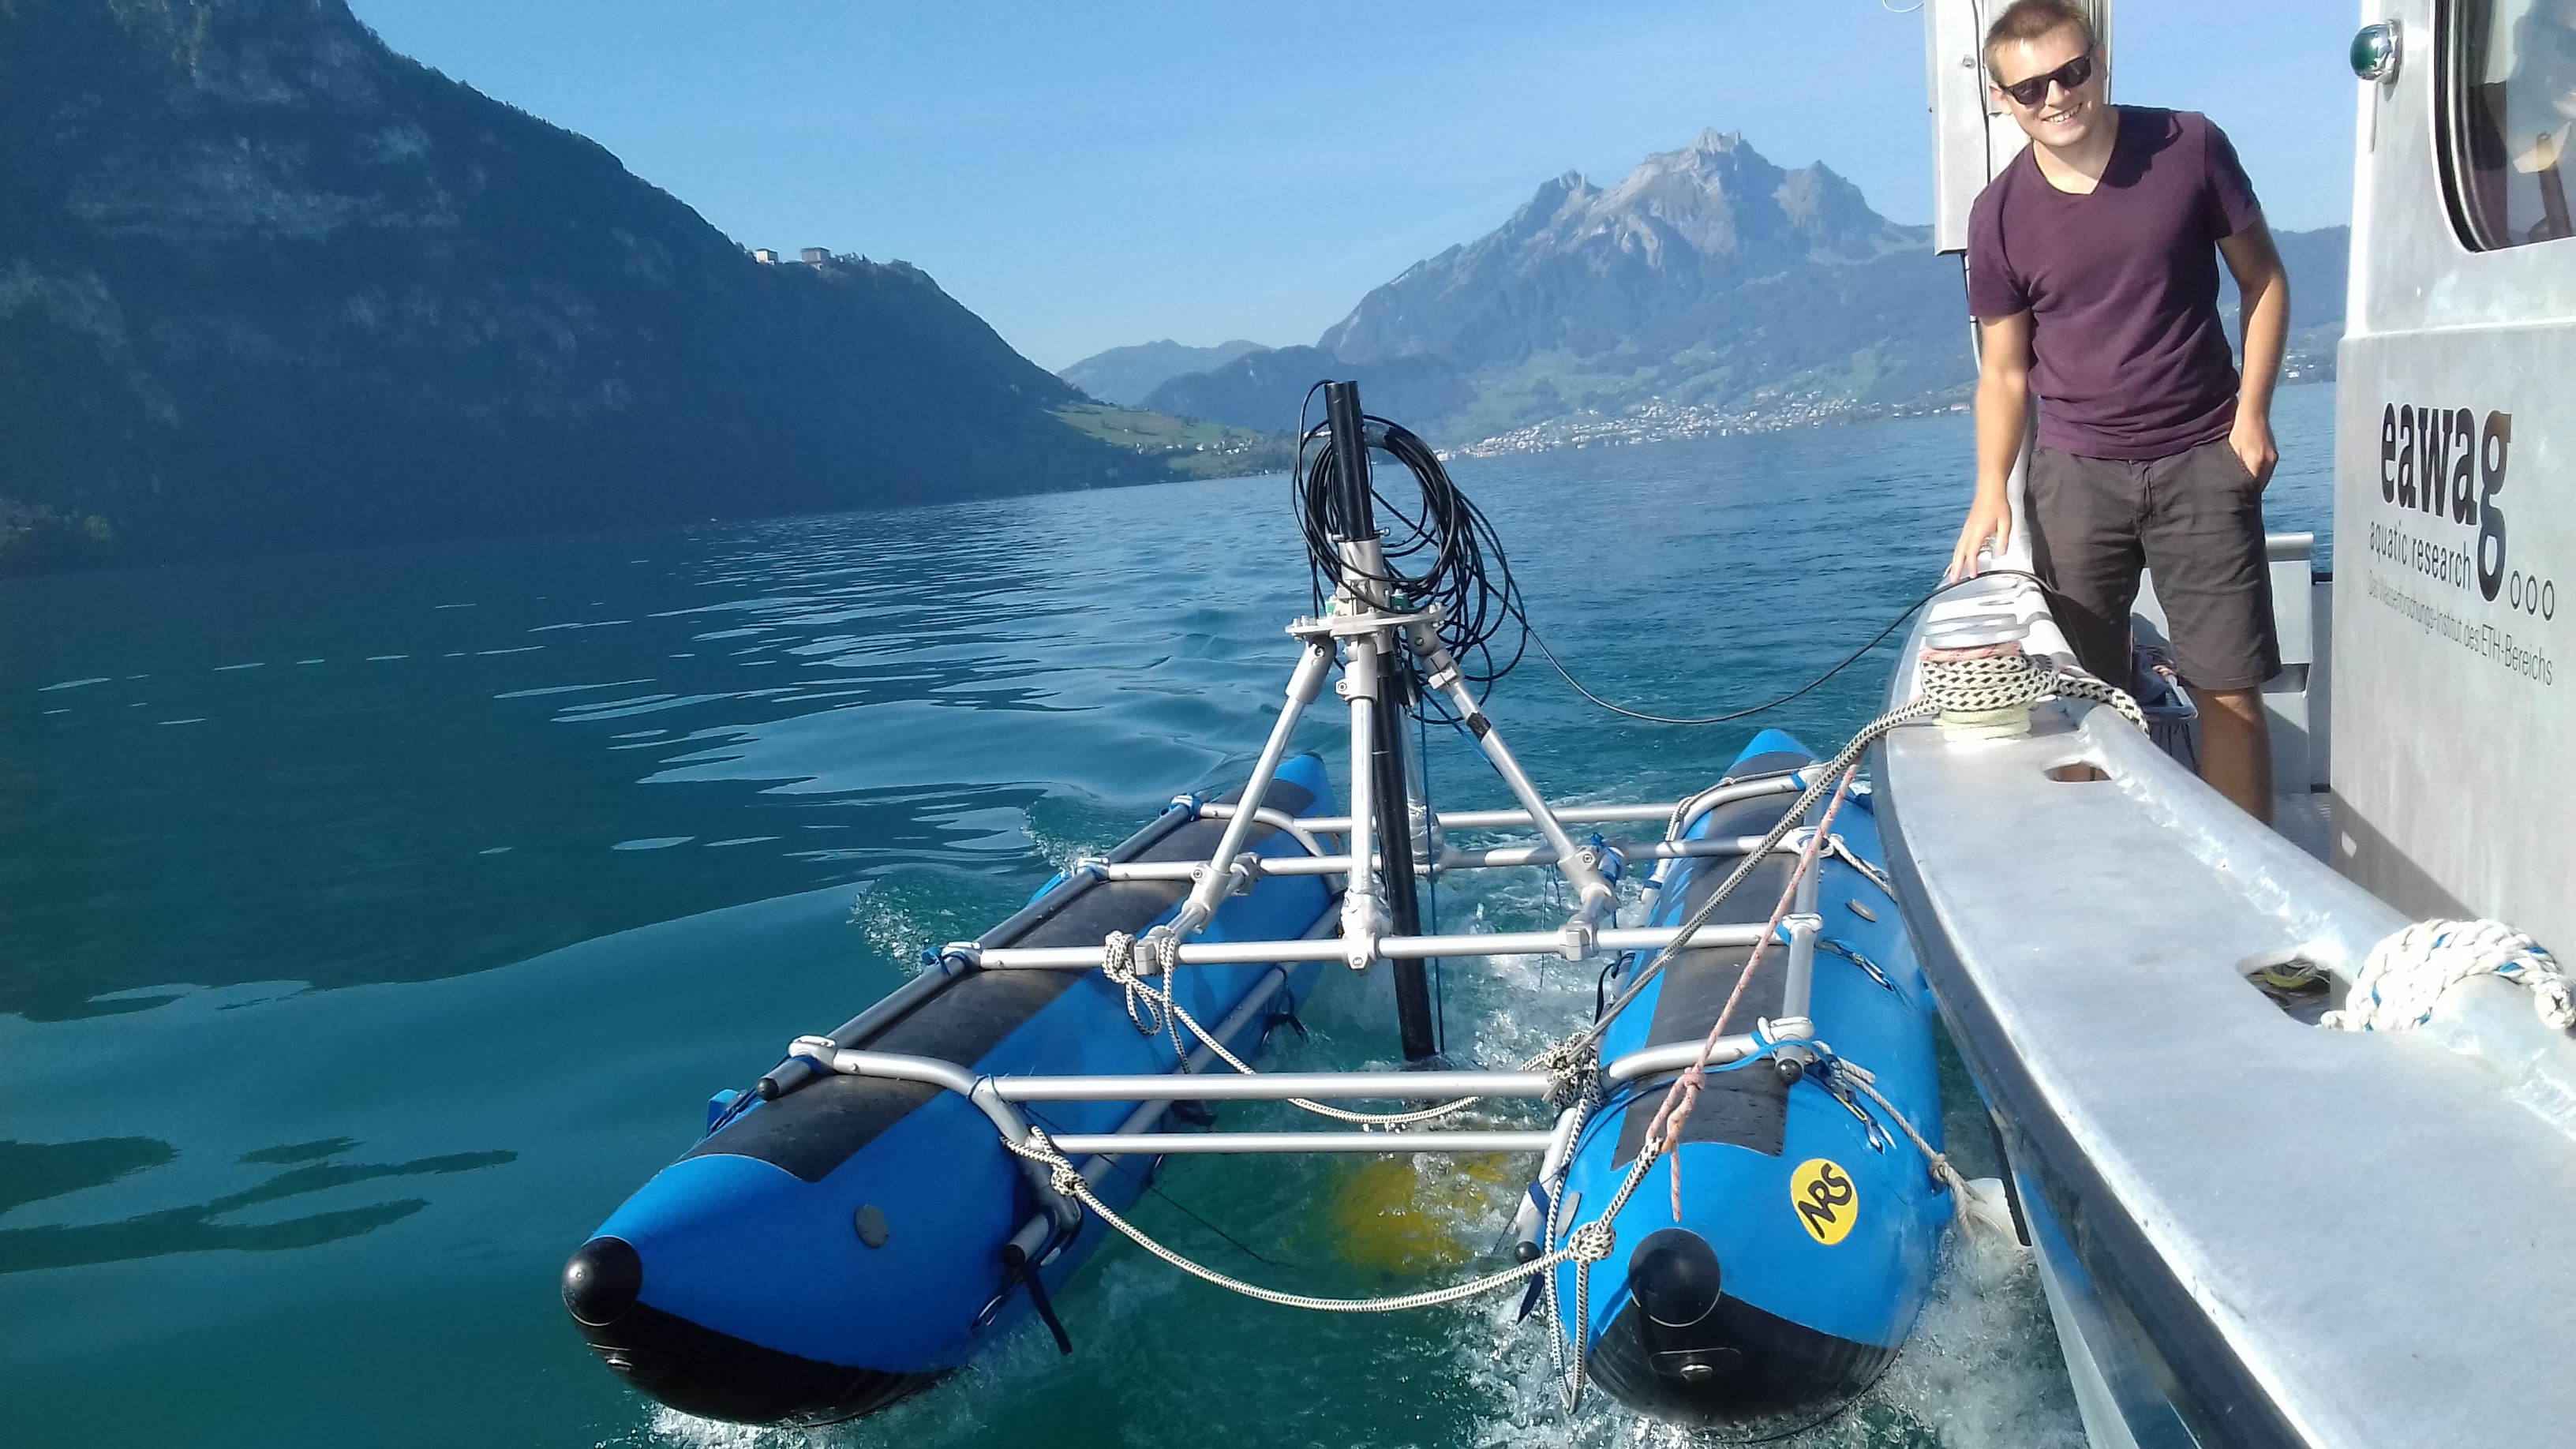
We spent our second annual workshop at EAWAG Kastanienbaum on the edge of Lake Lucerne, Switzerland (see previous posts). One component of this workshop was a field trip, where we split into three groups of five, and studied lacustrine landslides in three separate regions of Lake Lucerne. All the groups spent a day out on the lake collecting cores, 3.5 kHz seismic data and CPT data in their regions of interest, before processing the data and attempting to answer questions about slope stability (Weggis Slide), failure and flow mechanics (Zinnen Slide), the timing and lateral extent of the slide (Kastanienbaum, i.e. "SLATE Slide").
Weggis Slide Thomas Zengaffinen
ESR 13
Thomas Zengaffinen
ESR 13
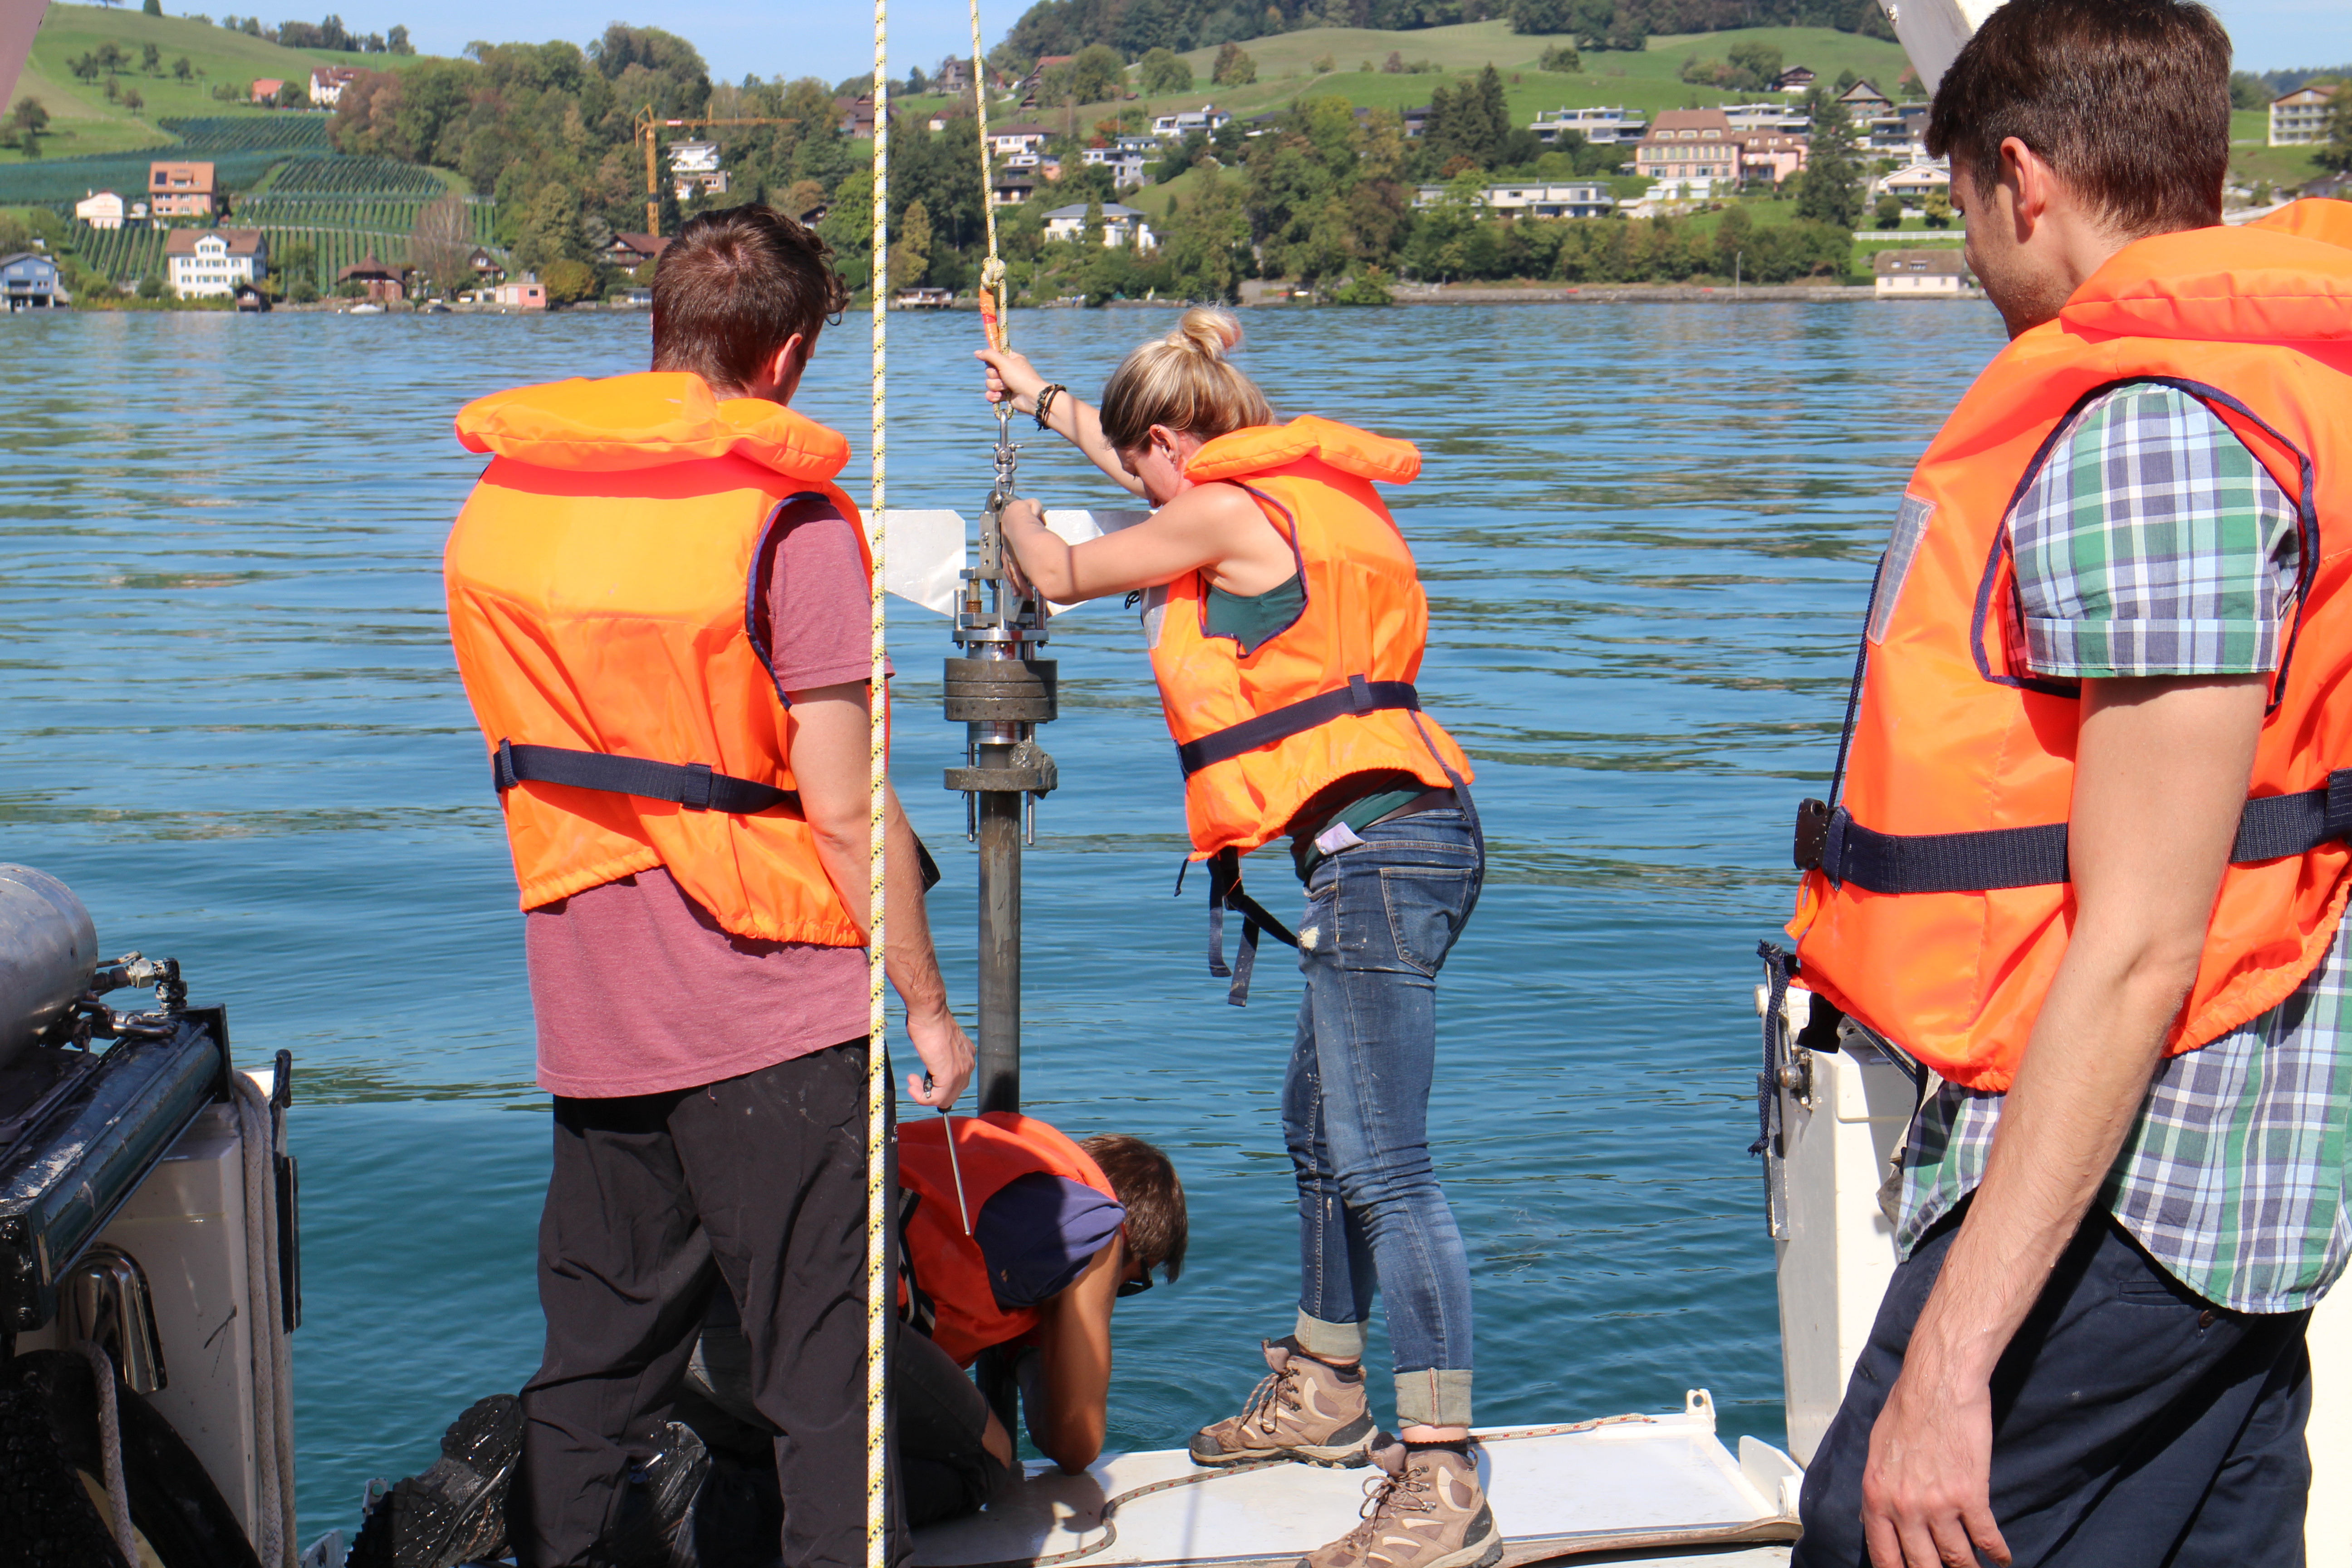
In this region, our aim was to assess the sediment stability by getting shear strength profiles of unfailed sediment layers. We began by collecting 3.5 kHz seismic data in the region of interest. This data showed past landslide deposits and unfailed terraces, which could be potential future landslide sediments. After studying the seismic sections, we decided on where to characterise the sediments by taking 1m deep sediment cores and measuring shear strength at about 4m depth. The next step was to open the collected cores, and then describe and interpret the observed layering.
In addition, we did Cone Penetration Tests (CPTs) at regular increments of a few centimeters along the core; the results of which could be converted into measurements of shear strength. This procedure resulted in shear strength profiles of the lake subsurface sediments at our decided spots.
This kind of analysing landslide sediments is not part of my daily work in Oslo. What I am working on in Oslo is simulating the landslide rather than working with sediments itself. Nevertheless, it was a qualitative experience that added to my modelling project. I got a feeling of how the mass of my simulated landslide may look like and how measurements of the slide mass are taken. All in all, this field trip gave me a new point of view of landslides. Working with sediment cores and assessing slope stabilities is a complementary discipline to my modelling project. I now have a broader understanding of my own project, and of the entire SLATE project.
Zinnen Slide Matthias Rauter
ESR 14
Matthias Rauter
ESR 14
My group investigated a slope a short distance west of the Weggis slide. The bathymetry of the slope shows multiple slides, presumably dating back to the earthquake of 1601. The slide scars are interrupted by stripes of unfailed sediment, giving the slope the look of battlements/towers (German: Zinnen) in the bathymetry. This particular feature makes the slope very interesting for our investigations. The unfailed areas allow us to investigate the pre-failure situation, layering and, to some extent, shear strength. The failed areas, on the other hand, allow insights into failure mechanisms and flow dynamics. The combination of both unfailed and failed slope areas gives a comprehensive recording of the 1601 landslide event. Furthermore, this slope provides us with valuable information for model validation, as the situation both before and after the event can be reconstructed from sediments.
We took seismic profiles, extracted core samples and performed CPTs in the slide deposit region and also in undisturbed sediments nearby. The results of this survey amazed me, as a model developer who has never been involved in field work; the data gave us a detailed view of undisturbed, compressed and sheared sediments, as well as debris flow and turbidity current deposits. I would never have expected to find such a detailed history of a landslide event in 400 year old sediments.
This experience changed my view on experimental geology substantially and I look forward to recalculate this or a similar event with models that we will develop over the next few years.
SLATE Slide Rachel Barrett
ESR 1
Rachel Barrett
ESR 1
Our project was structured a little differently to the other two groups, due to only having two surveying vessels available. Consequently, we began the field work component of this workshop with half a day of project planning, before acquiring 3.5 kHz seismic profiles, cores and CPTs, and then processing and analyzing the data.
Our study area was just 300 m offshore from EAWAG at Kastanienbaum. A landslide headwall was evident in the multibeam data (see Figure), but few seismic profiles and no cores or CPT data had been acquired in the area, so the landslide (dubbed "SLATE slide" by our team) was relatively unsurveyed. Our aims were to determine the lateral extent and volume of the slide, find out information about the nature of the basal glide plane, and try to constrain the timing of the slide. With this in mind, we constructed a survey plan for the two half days of data collection.
For me, being involved in the project from the initial planning stage was a really valuable experience. We had identify what our key priorities were, and then had to keep coming back to those while surveying, so as to optimize the time spent collecting data. This was especially important when we began to run out of time while collecting 3.5 kHz data due to over-ambitious planning, and was a great exercise in flexible thinking.
Integrating multiple types of data and approaches is critical to getting the full story in any geological area; and so working with core and CPT data was also a helpful learning exercise for me, because, as for Thomas and Matthias, working with these data is not a regular occurrence.
Designing a survey to investigate a landslide, acquiring data, and processing/analyzing that data in such a short time (only two days when we could have easily used one or two weeks) was definitely an ambitious project; however, I think it is safe to say that all fifteen of us learnt something new or developed a skill/skills, and also enjoyed ourselves during the field work exercise.
Related blog posts from the 'Lake Lucerne Workshop' blog series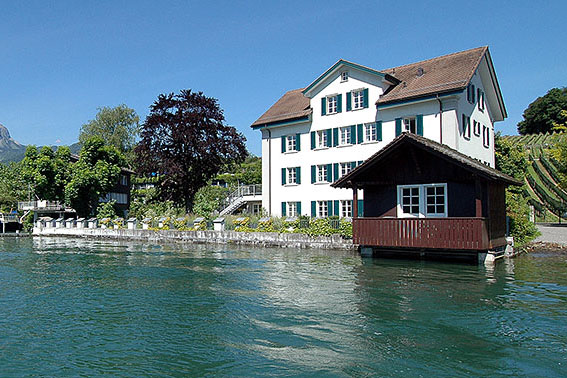
- EAWAG Kastanienbaum (Lake Lucerne)